


Fun with Data! - Furnace vs. Arctic Bomb Cyclone
How does an "Arctic Bomb Cyclone" change how often a furnace runs? Can it keep up with the plunging temps? What does that cost?

Note: “Fun with Data!” posts focus on fun and sometimes silly applications of data analysis.
In Indiana the “arctic bomb cyclone” hit us just before Christmas. On Thursday (12/22), temperatures plunged by more than 45 degrees in 18 hours, falling from 35(F) at 11am to -11(F) overnight. On Friday temperatures remained negative and winds gusted as high as 60mph. It wasn’t until Saturday morning at that temperatures rose back above zero again. Knowing this was coming, I thought it would be a perfect time to generate some interesting data for analysis! Over this time I had the thermostat set to maintain 68 (F) degrees and tracked the data it provided (it’s an Ecobee) to see how the furnace would keep up. Below is a chart of the results.
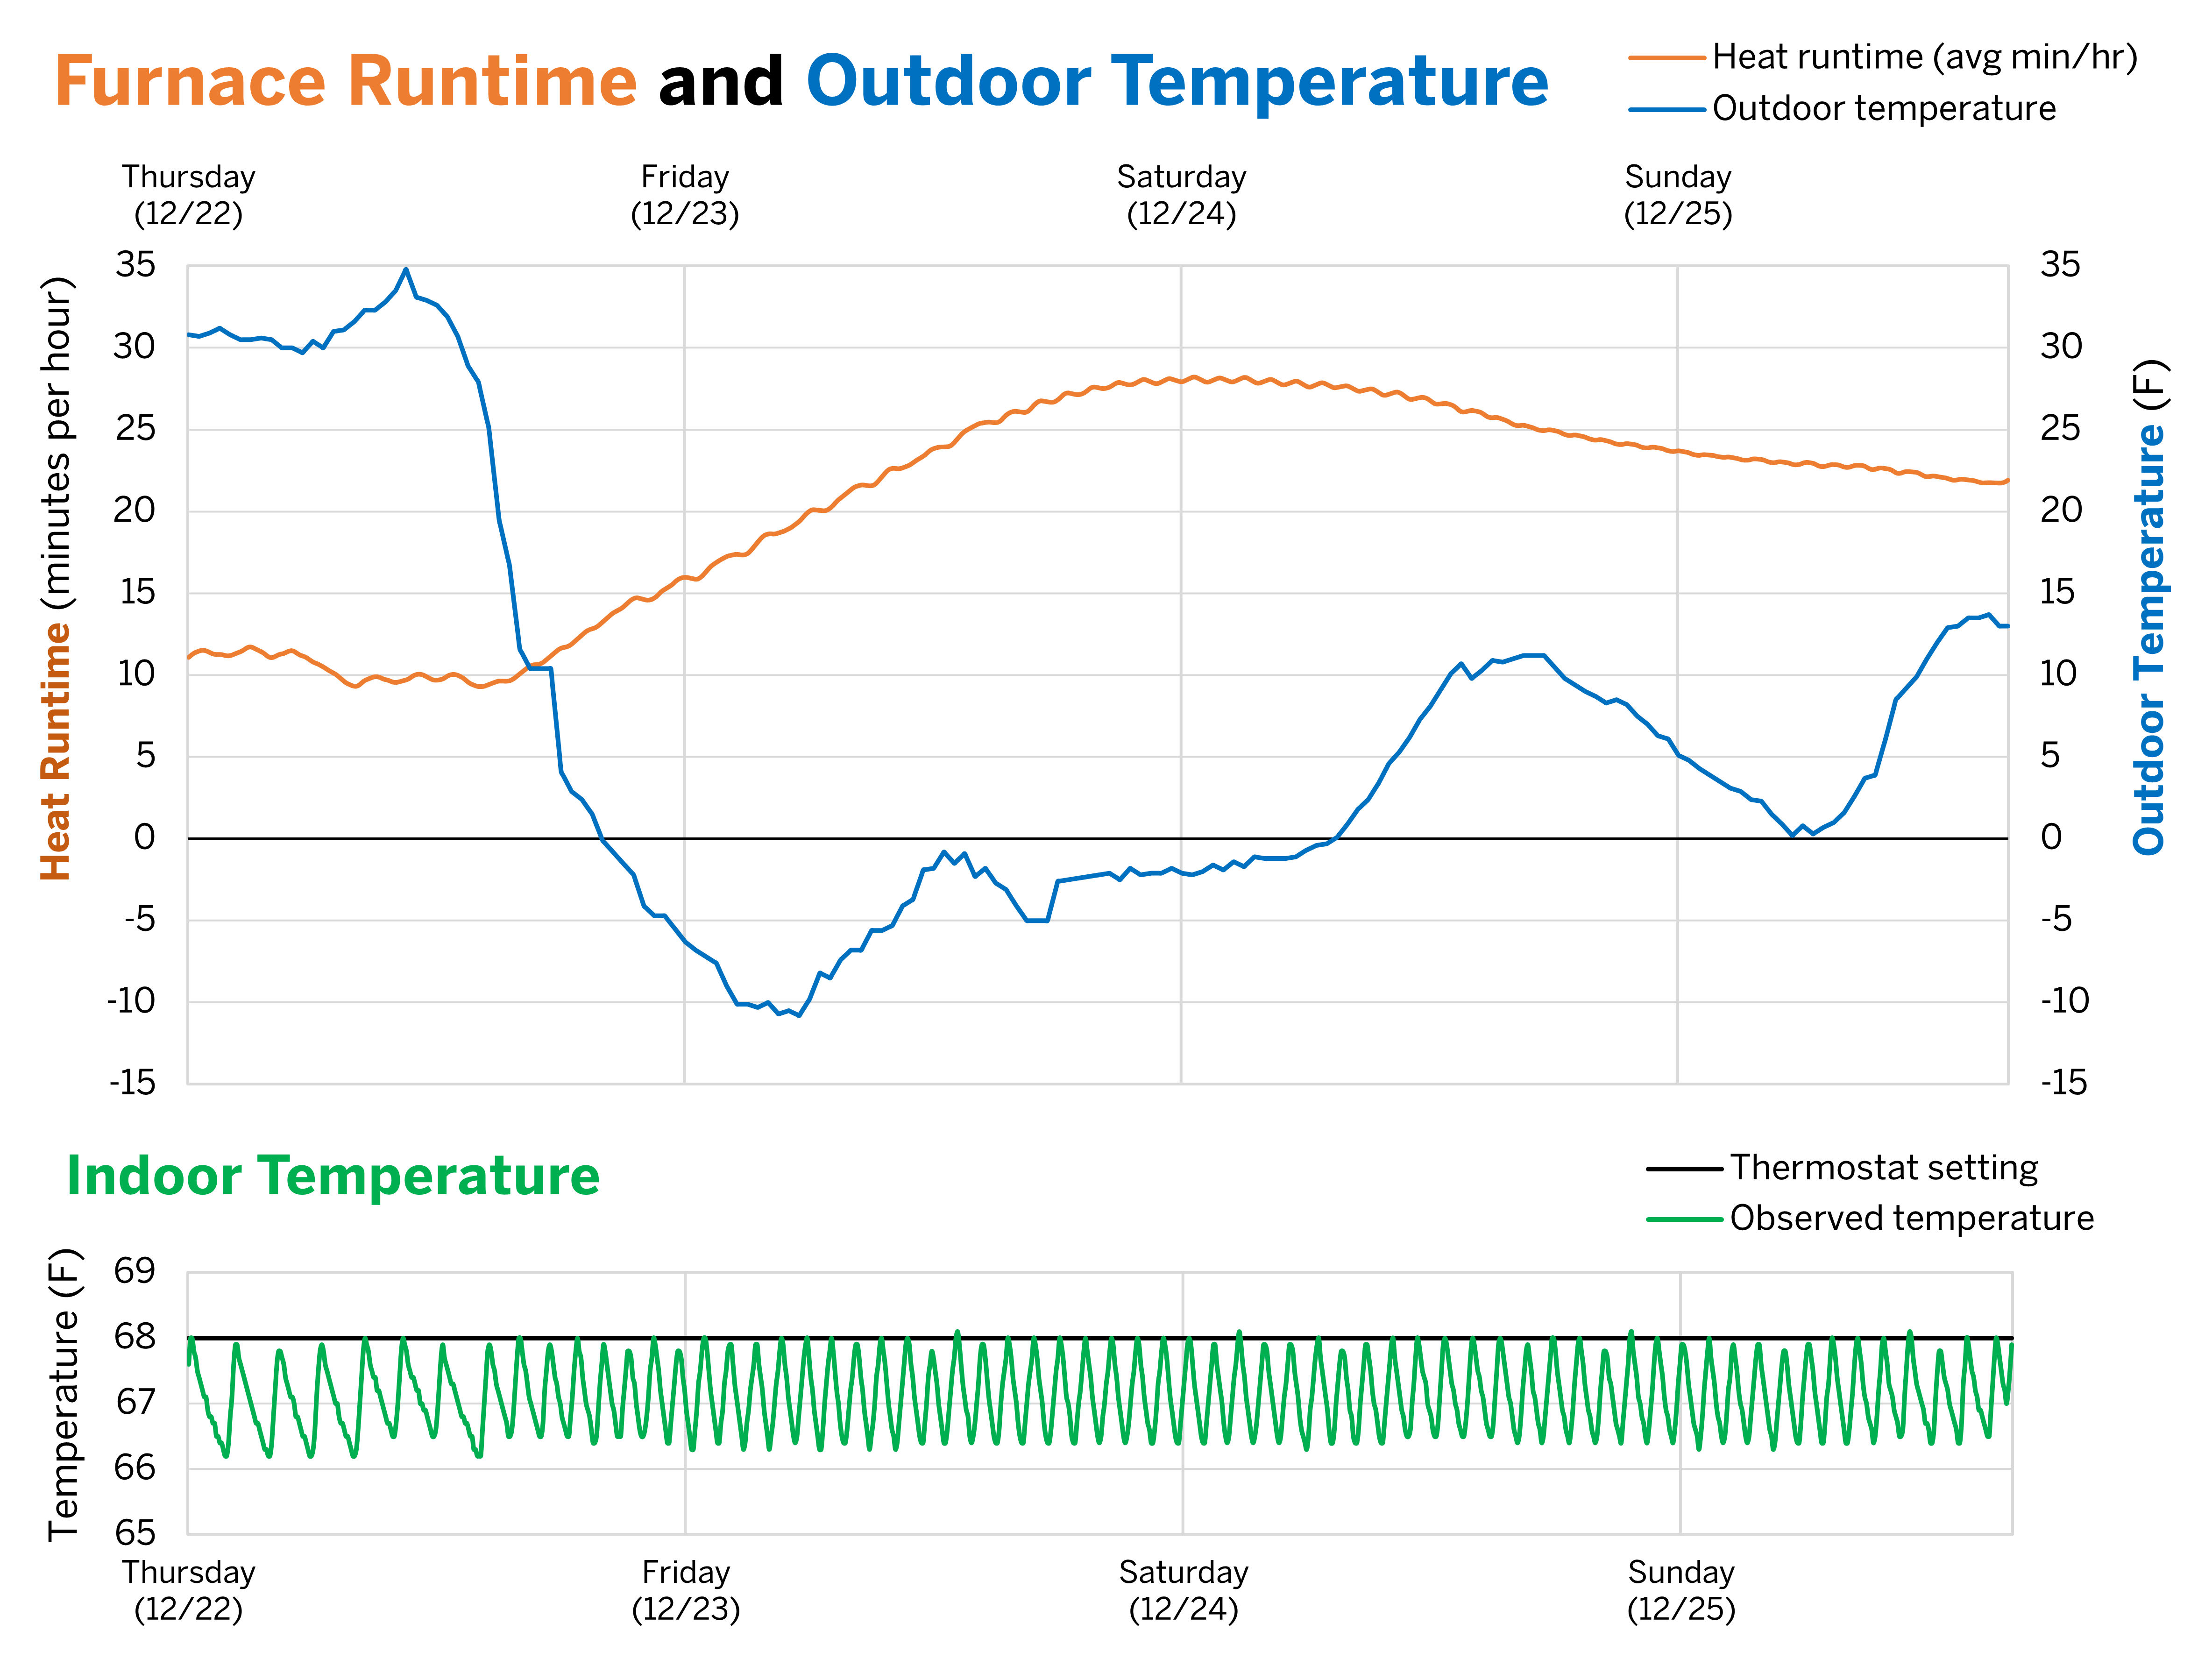
Edit: Forgot to add above in the charge above that furnace runtime is smoothed by averaging over the previous 24-hour period.
On to the results!
1. The furnace kept up, but had to run three times as often
Before the cold hit, the temperatures were in the 30s (F) and the furnace was running about 10 minutes/hour (17% of the time). After the cold hit, the runtime rose steadily to a peak of 28 minutes/hour (47% of the time). At the very worst point, the furnace had to run about three times as often to keep up with the extreme cold (orange line in the upper chart).
2. The furnace kept the temperature stable thanks to good insulation
Despite the rapid temperature drop and extreme cold, the furnace was able to keep the indoor temperature within two degrees of the target the entire time, or between 66-68 degrees. The thermostat records the indoor temperature every five minutes, and it never recorded a temperature of less than 66 (green line in lower chart). This would only have been possible thanks to good insulation. One way to see the effect of insulation is by looking at how long it took for the furnace runtime to reach a new equilibrium after the cold hit. Even though temperatures dropped rapidly on Thursday afternoon and evening, because of the trapped heat in the house, the furnace runtime only slowly rose to reach its maximum runtime more than 24 hours later. In a drafty house with poor insulation, it would have had to ramp up much faster.
3. Maintaining the temperature only cost about $10 more during the extreme cold
With some back-of-the-napkin math we can estimate the additional cost of maintaining 68(F) during the bomb cyclone. To do this, I estimated ccfs per hour based on the furnace BTU and then converted that into therms. I then multiplied this by total price per therm from my utility provider to get an estimated cost per hour of runtime for furnace. Multiplying this cost by the total runtime each day we can get the estimated cost per day. Before the cyclone hit it cost roughly $5.00/day to heat the house. On Friday this rose to about $10/day, on Saturday to $8.50/day and Sunday $6.00/day. So, the additional cost of heating the house for these three days was only about $10! An absolute steal considering how cold it was outside. This is a very rough estimate but, on average, is probably reasonable.
Overall, this was a fun little data collection and analysis project! Smart thermostats provide a wealth of data which I always enjoy playing with. I was surprised that the additional cost to offset the extreme cold wasn’t more, but the house is relatively new and well insulated. These results are not meant to be representative, and will vary greatly depending on the furnace, size of the house, how well the house is insulated, cost of gas, and many other factors.
Data are all around us and they can often be used to answer fun and interesting questions. Thanks for reading!