Indiana Covid Update (12/10/2022)
With a closer look at wastewater viral concentration and hospital admissions
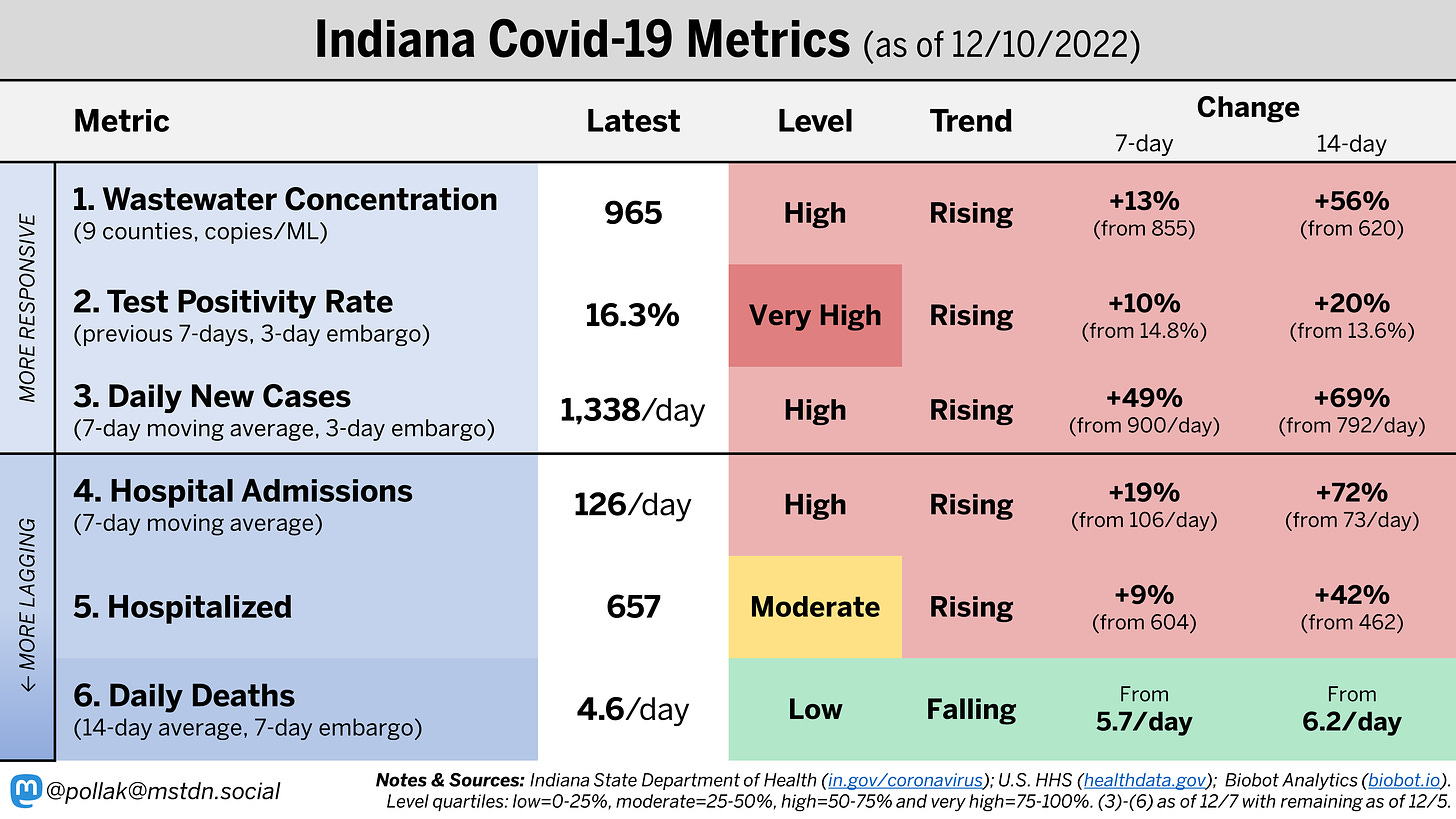
Below is the latest dashboard of Covid-19 metrics for Indiana. All metrics are rising (other than daily deaths, which often lag weeks behind the others). All metrics other than the number of people currently hospitalized for Covid are high and the test positivity rate is very high.
While each of the metrics above are useful, the most meaningful metrics are wastewater concentration (1) and hospital data (4 and 5):
Wastewater viral concentration is the closest we can come to measuring actual infections in the community today. It does not depend on the amount of testing being done.
Hospital admissions and hospitalized are the two best measure we have of the amount of severe illness infections are causing in the population.
Below I dive a deeper into these two sets of metrics.
Wastewater trends by Indiana county
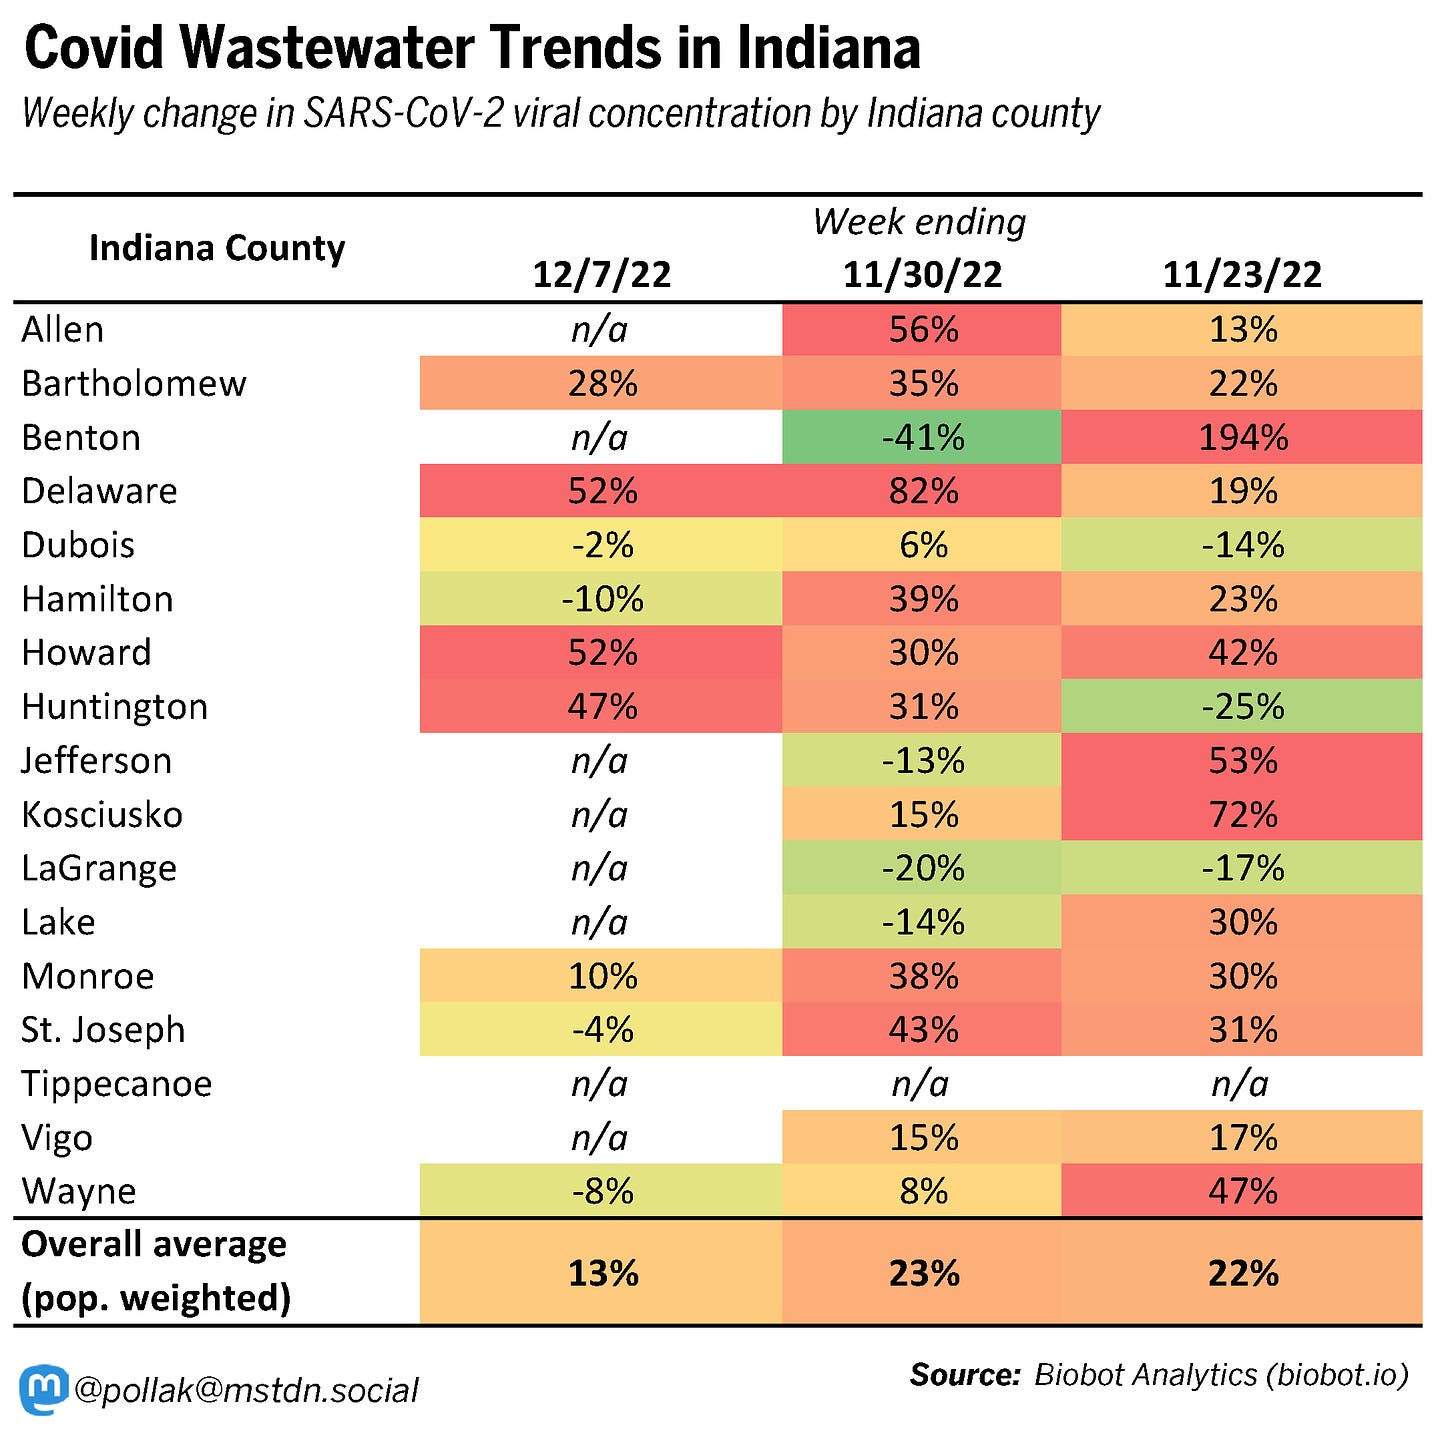
The dashboard above provides a population weighted average for all counties which have reported data for all of the last three weeks (a total of nine counties). This is a summary of the most recent wastewater data, but there are a total of 17 counties which collect and report wastewater viral concentration in Indiana on varying schedules. In the graphic below you will find the most recent weekly trends available for all of these 17 counties (including those that have not yet reported data for 12/7).
Based on the graphic above, wastewater viral concentration is rising rapidly in all counties which report these data. While there are a few single weeks in which viral concentration has fallen, these are offset by high growth in the other weeks.
Hospital Admissions for Covid
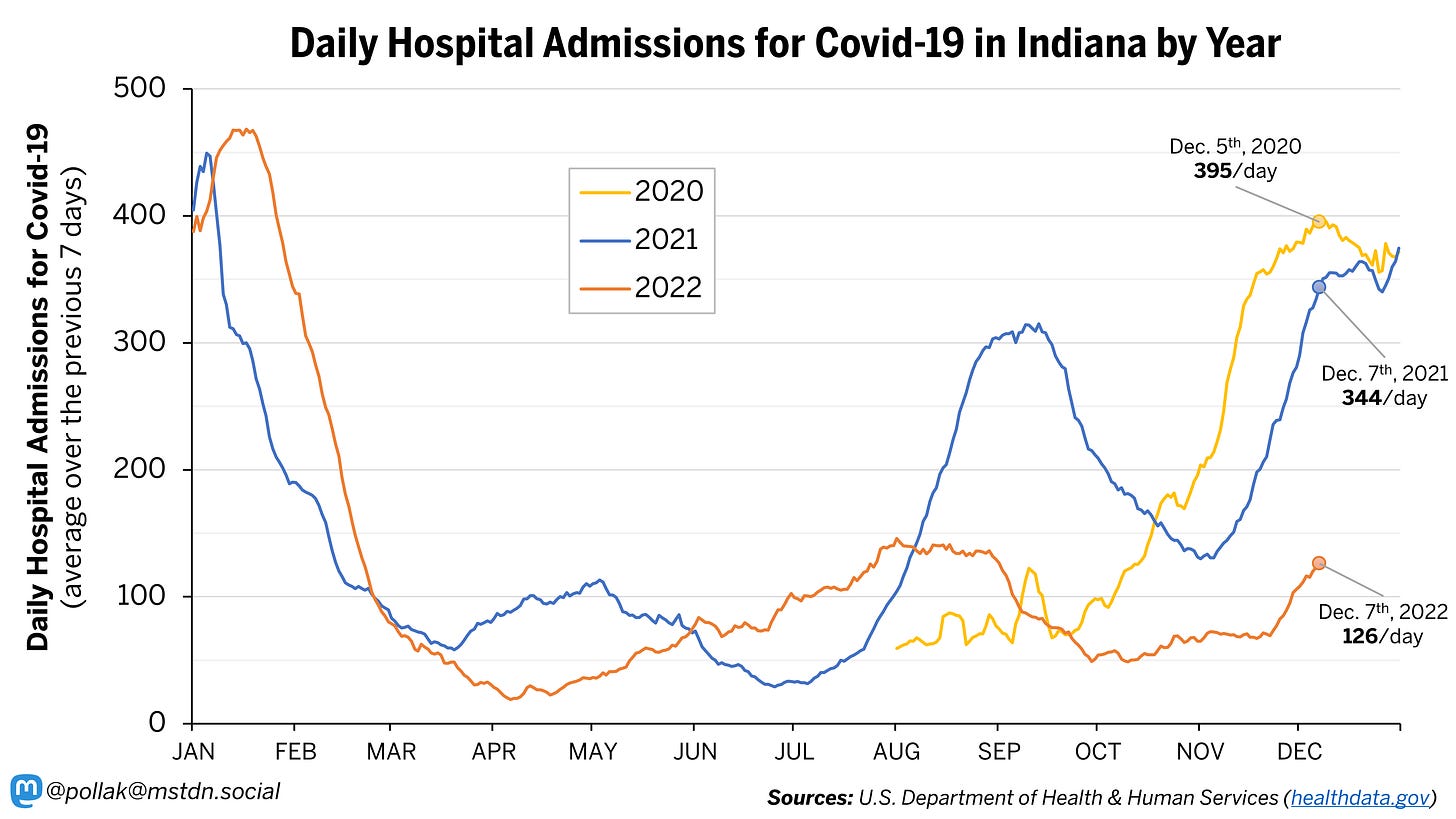
Wastewater SARS-CoV-2 viral concentration in Indiana is at a high level (on the verge of becoming ‘very high’ or in the top 25% all time) and rising. This is the best proxy measure we have for the amount of infections occurring in the community (rather than those infections which are found through testing). However, with the growing level of protection the population has due to vaccination and previous infections, a high level of infections does not necessarily result in as high a level of severe illness. The best measure we have of the level of severe illness resulting from the SARS-CoV-2 virus comes from hospitals. The graphic below shows the average daily admissions for Covid (not found incidentally) in Indiana by year. Currently (as of 12/7) there are 126 people per day on average being admitted to Indiana hospitals for Covid. While this is significantly higher than the middle of November (when we were averaging around 70/day), it is by far the lowest for this time of year since the pandemic began.
Last year at this time we were admitting 344 patients/day (2.7 times as many now) for Covid and the year before 395/day (3.1 times as many as now). Another way to look at this is the total number of patients admitted since the start of November:
Nov. 1 to Dec. 7th 2020: 12,557 people were admitted for Covid
Nov. 1 to Dec. 7th 2021: 8,557 people were admitted for Covid
Nov. 1 to Dec. 7th 2022: 3,266 people were admitted for Covid
While so far the number of people admitted for Covid during the Winter 2022-23 wave is a fraction of the two previous years, healthcare workers in Indiana are still stretched very thin due to the high rate of circulation of other respiratory viruses.
Hospital Utilization
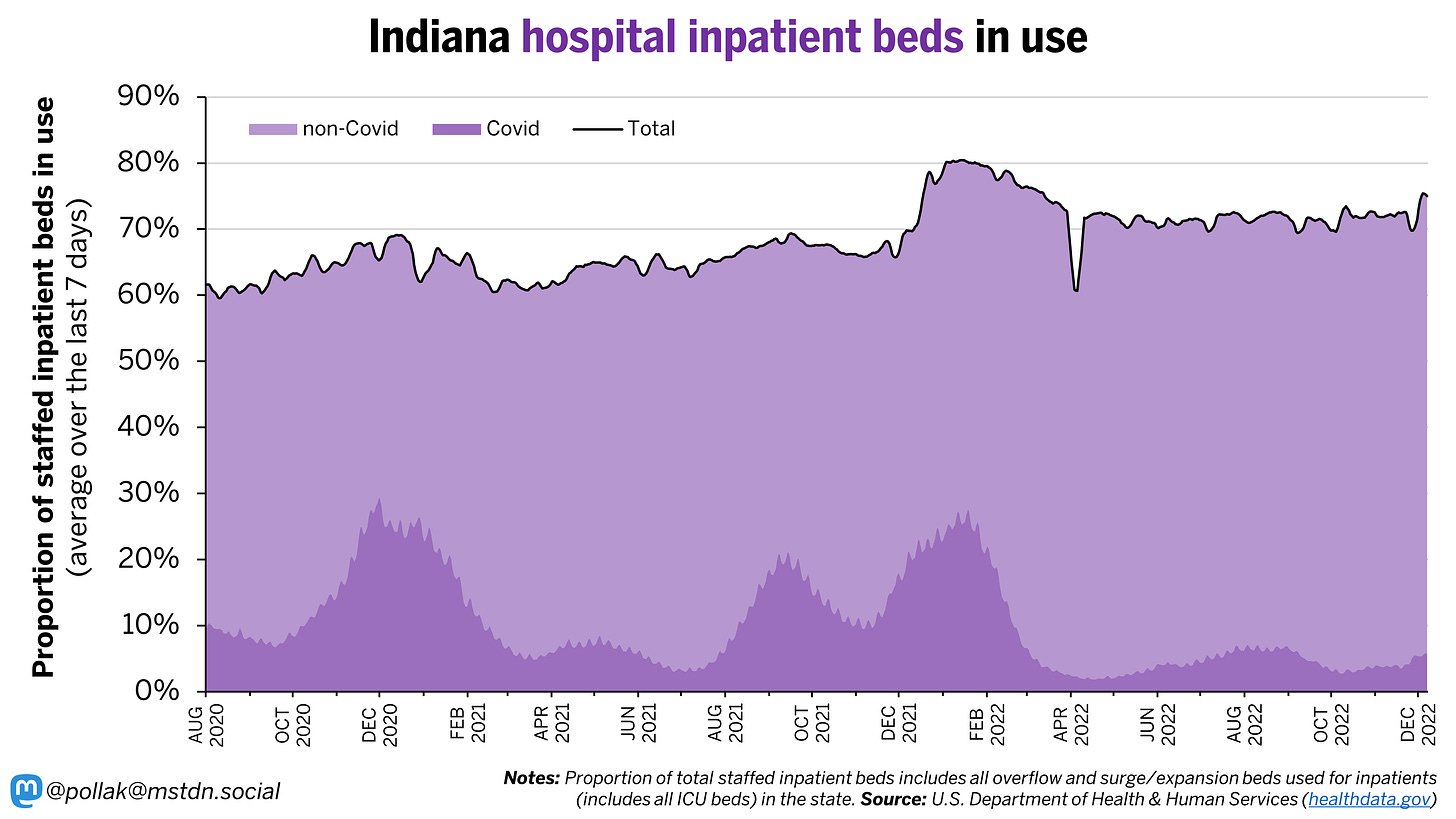
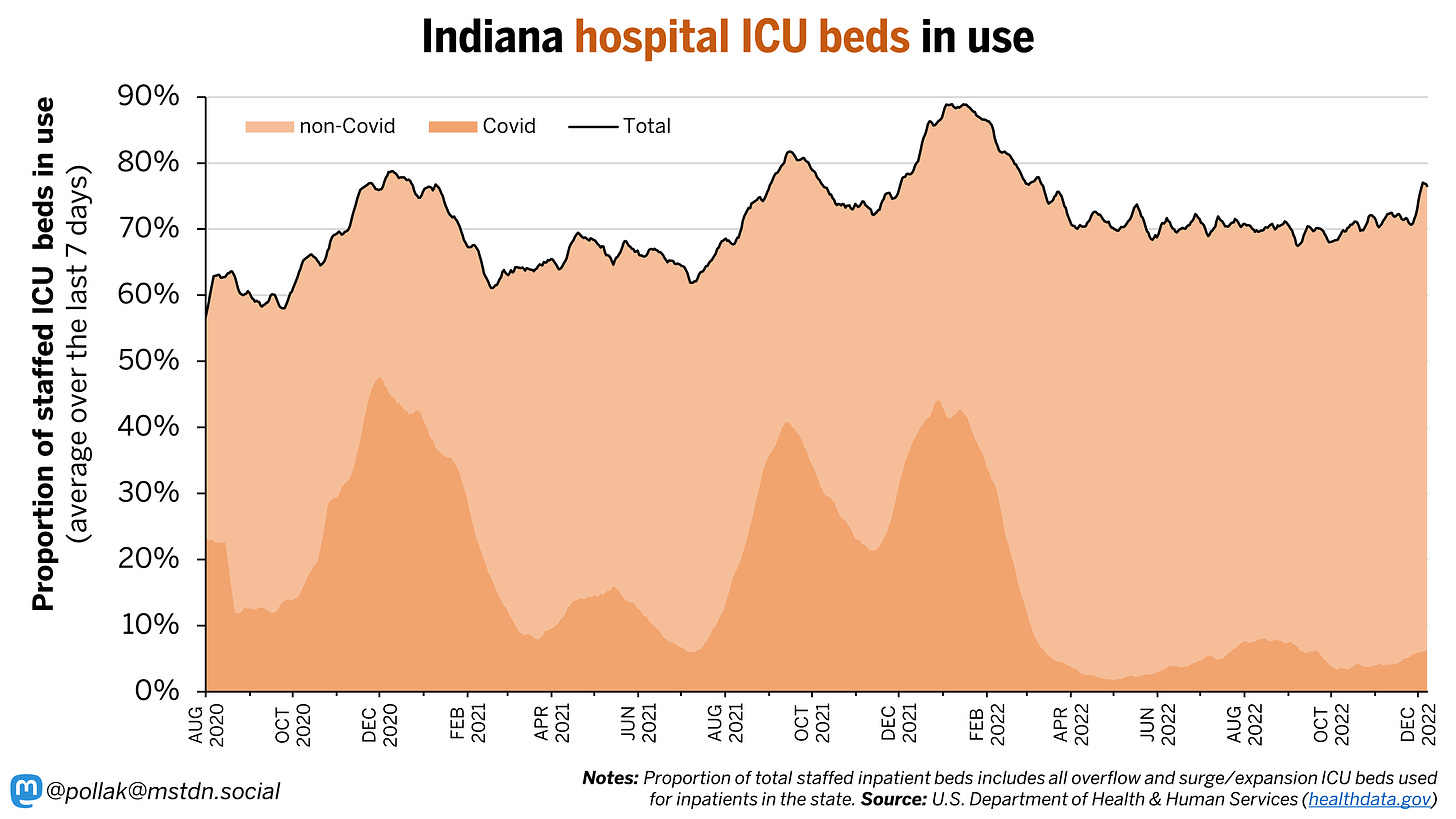
The graphic below shows the proportion of Indiana inpatient hospital beds in use over time, broken down by both Covid and non-Covid uses. Currently 77.5% of all staffed inpatient beds (this includes ICU beds) are in use. This is the highest rate since March 2022 when we were coming down from the first Omicron wave. This high rate of inpatient bed usage is being primarily driven by admissions for non-Covid reasons, rather than Covid admissions. Today 5.7% of all inpatient beds in use are for Covid versus 21.1% exactly one year ago. This is consistent with what we saw above: the number of people being admitted to hospitals in Indiana for Covid is rising, but still at seasonally low rate. Rather, it is admissions for non-Covid reasons (mostly other respiratory viruses) that are driving up hospital bed usage.
Below you will find a similar graphic but for ICU beds specifically. The story is similar, but more stark. Today 6.3% of all ICU beds in Indiana have Covid patients versus 36% exactly one year ago.
Key takeaways
My three key takeaways are:
Covid infections are at a high level and still rising. However, while hospitalizations for Covid are rising, they are still at a relatively low level.
Respiratory (non-Covid) viruses are running rampant right now, at levels we haven’t seen since before the pandemic began.
Please consider taking extra precautions like wearing a high quality mask (N95, KN94 or KF94) in public spaces and avoiding or limiting the number of large gatherings until things calm down.
Finally, one last reminder that while hospital admissions are one measure of severe illness, there are other long-term health risks. Long Covid continues to be a risk, even for mild or asymptomatic infections. No one ever regrets avoiding getting infected by a virus (whether SARS-CoV-2, Influenza, RSV or something else). If you are not already taking extra precautions to avoid being exposed to the many viruses circulating right now, please consider doing so.
Be well and stay healthy!


Thank you!