


The 2022 Flu Season
Second worst in at least a quarter century

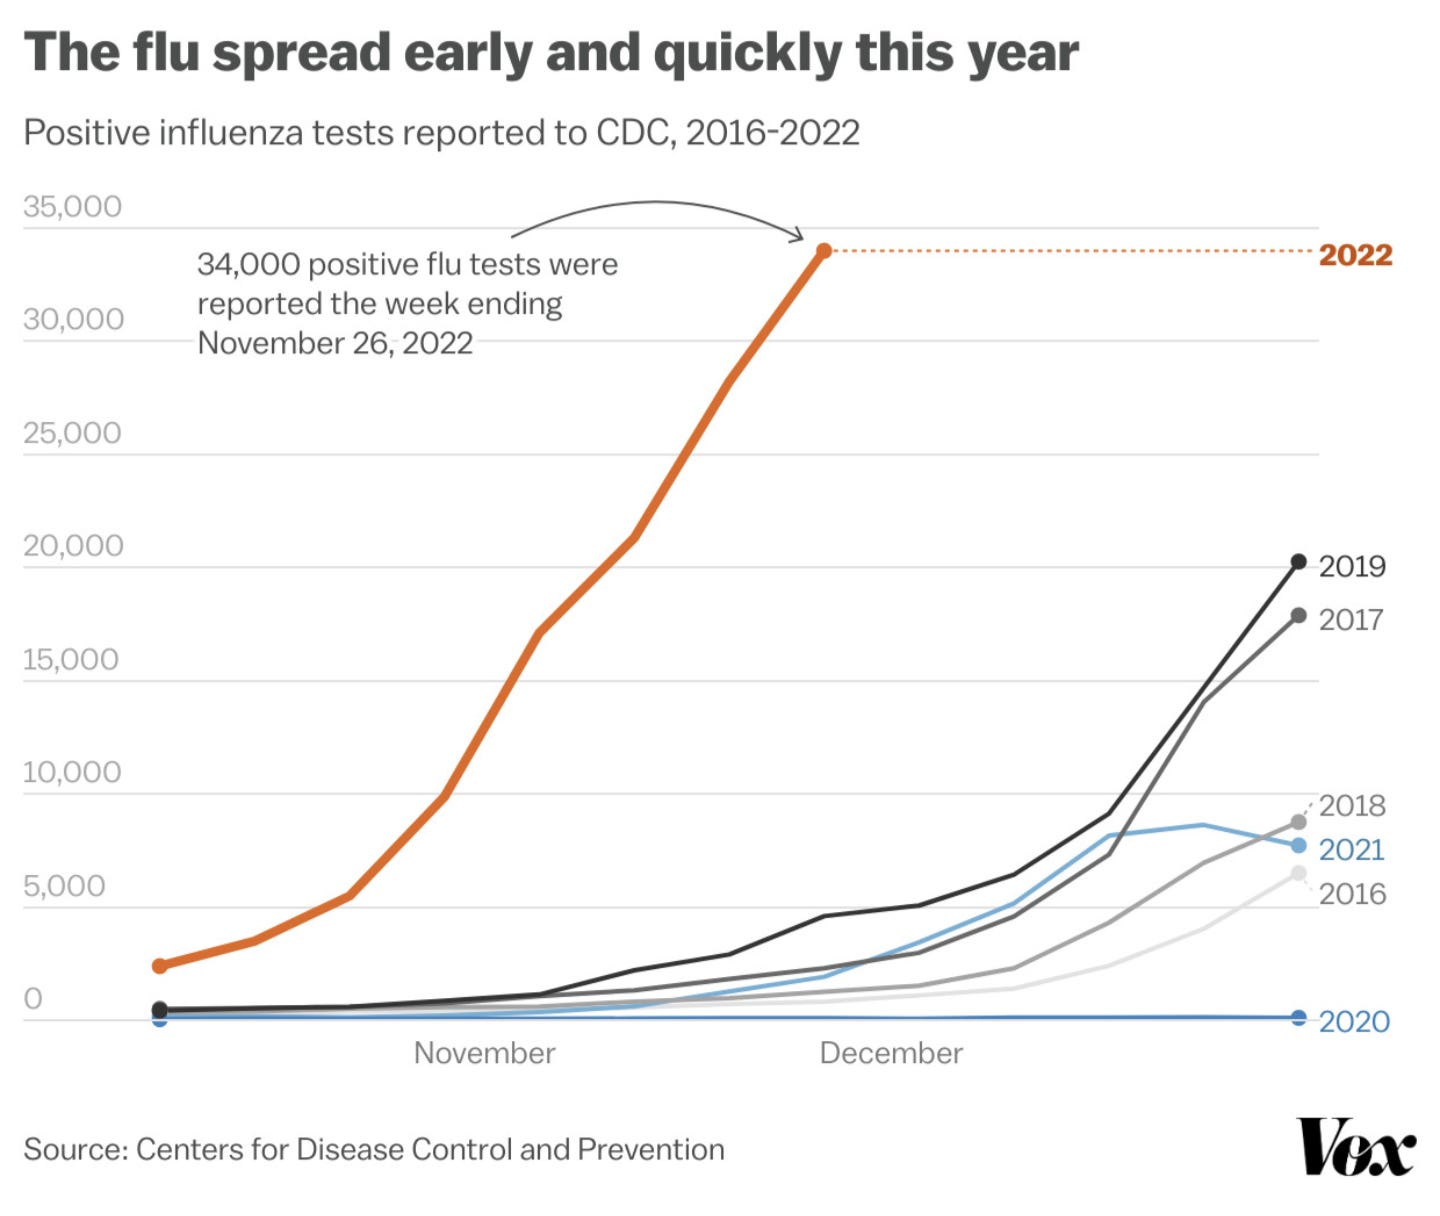
Unless you’ve been living under a rock somewhere (a hermetically sealed rock!), you probably have a friend, family member or co-worker who is either currently sick or just getting over something. The flu season this year seems to have come early and, man, has it been a doozy! But given that the last two years had unusual influenza seasons due to Covid, how unusual is this year really? You may have seen wild looking charts, like the one below from this Vox article, showing how the flu has spread earlier, more quickly, and wider this year than recent years. But is this flu season actually worse than the typical flu season?
The short answer is: Yes, it’s very likely we’re in the midst of the second worst flu season in a quarter century (or longer).
Are we just testing more?
Since September, a total of over 200,000 people in the United States have tested positive for the flu. Our usual average for these first few weeks is around 10,000. Put another way, roughly 20 TIMES more people have tested positive for influenza so far this season than usual. During these first 10 weeks of this flu season, more people have tested positive than the previous 109 weeks COMBINED (the previous two years and then some; since December of 2019).
But what about the old Covid adage: “Well, we’re just doing more testing so of course we’re finding more cases!” This is a factor, but the majority of testing is being done because so many people are sick, and these tests are coming back positive at unusually high rates. Those 20 times more people testing positive are the result of doing only 10 times as much testing. The chart below shows the number of influenza tests administerested in the United States by flu season going back to 2012-2013 with orange reflecting the positive results and light blue reflecting the negative results.

A couple of observations on this chart:
The number of influenza tests administered has been steadily rising and rising much more rapidly in the last two years. Last flu season we administered 4.98 million influenza tests, or twice as many as the season before that which, at the time, was the highest ever.
We are 10 weeks into the current season, and have administered 1.32 million tests so far. This is much higher than usual for this time of year but this likely reflects higher demand for testing as more people are sick (see next point).
The positivity rate of these tests so far is 15.7%, which is much higher than the the full season historical average (from 1997-2021) of 10.7%. If we were uncovering influenza cases simply because we were “testing out of an abundance of caution” then we would expect the positivity rate to be quite low (as it was the previous two flu seasons).
Putting these points together suggests that while we are testing more each year (which is good), the testing being done this year is mostly a reflection of people needing to be tested (i.e. people are sick) rather than anything else.
There’s a lot of influenza out there, like a LOT
One way to try and avoid distortion due to differences in the amount of testing being done, is to look at what proportion of people showing up to healthcare facilities (urgent care, emergency departments, physician’s offices, etc.) are there primarily for non-Covid influenza-like illnesses. Symptoms of influenza-like illnesses (ILI) are defined as an “illness with fever or feverishness plus either cough or sore throat.”
The chart below shows this proportion for the current year (2022) compared with previous years (1997-2021). As of week 49 (ending December 10), 6.9% of all healthcare visits are primarily for an influenza-like illness. That’s more than three times higher than the typical 2.2% rate average from 1997-2022.

In fact, only in 2009 during the H1N1 (swine flu) pandemic have we ever recorded higher rates of ILI earlier in the season. Based on this, the current flu season is shaping up to be the second worst we have experienced in the last quarter of a century (at least since 1997, which was when these data were first collected).
Could Covid cases be driving up these rates? Probably not significantly so. While we are experiencing a Covid winter wave, so far it has been the mildest one since the Covid pandemic began. Furthermore, confirmed Covid cases are excluded from the ILI data above and without a bottleneck on Covid testing for healthcare facilities this year almost everyone coming in is likely being tested.
There is also evidence that these high rates of influenza infection are leading to high rates of more severe outcomes. It is possible (likely?) this flu season will ultimately end up being the most deadly since the H1N1 pandemic in 2009.

However, there is some good news. While influenza infections have been higher and rising much faster than our typical flu season, it looks like they may have already peaked nationally at the end of November and started to decline. Infections peaking this early is very unusual (again, see 2009 for the other exception), and we may see a second influenza wave before the winter is over but this is still good news.
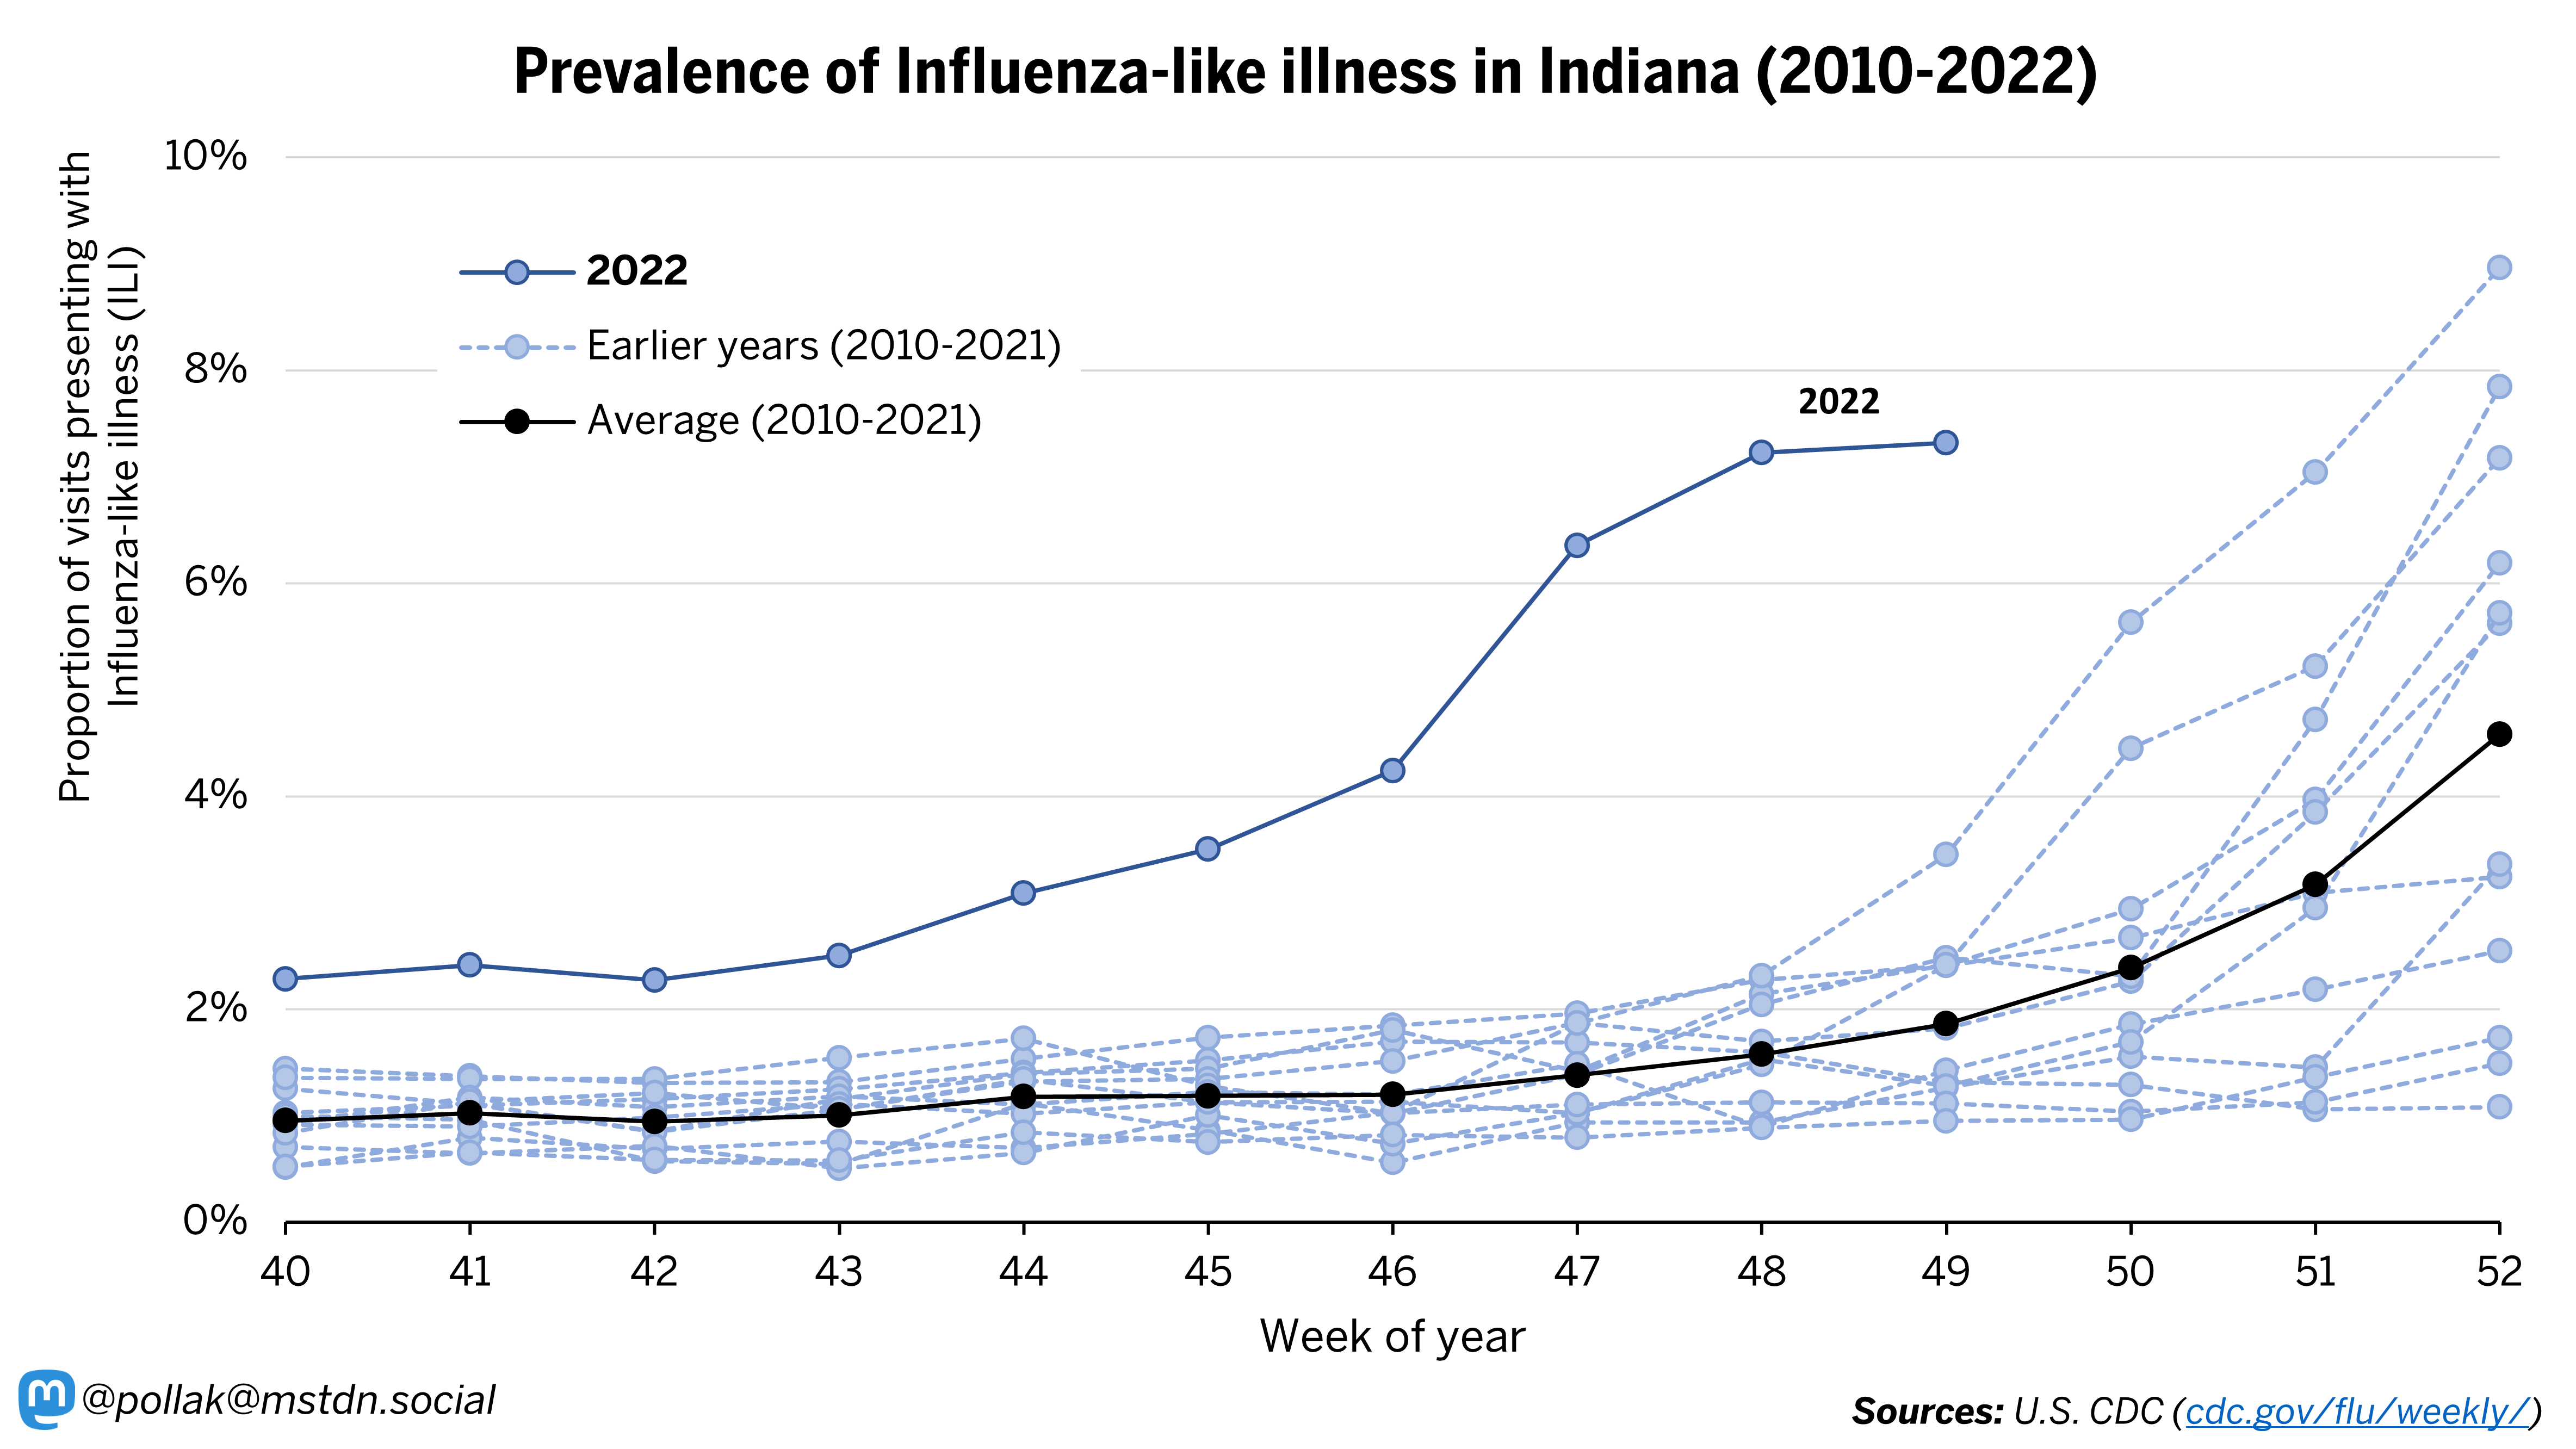
What about in Indiana?
In Indiana we might not be out of the woods yet. The chart below shows the same influenza prevalence metric (ILI) for the state. Unlike nationally where ILI visits peaked and declined during the past two weeks, here in Indiana they are still on the rise.
The Bottom Line
We are likely in one of the worst influenza seasons in recent history and it’s not over yet. If you haven’t gotten your flu shot yet, please seriously consider getting it as soon as possible. The flu vaccine this year is a close match to the strain circulating (Influenza A/H1N3) and most being hit hard by the flu are those not vaccinated.
This is really informative. Thank you. I'm curious what you can say about the RSV season we are having, or what data we should be able to access.