


Indiana Covid Update (12/22/2022)
Infections are falling, but beware the holiday bounce!

Happy holidays! I hope you are all safe and warm somewhere for the next few days at least. It’s so cold here in the Midwest that even Harry Barker doesn’t want to go outside, and corgis are from the same family of Spitz dogs as huskies!
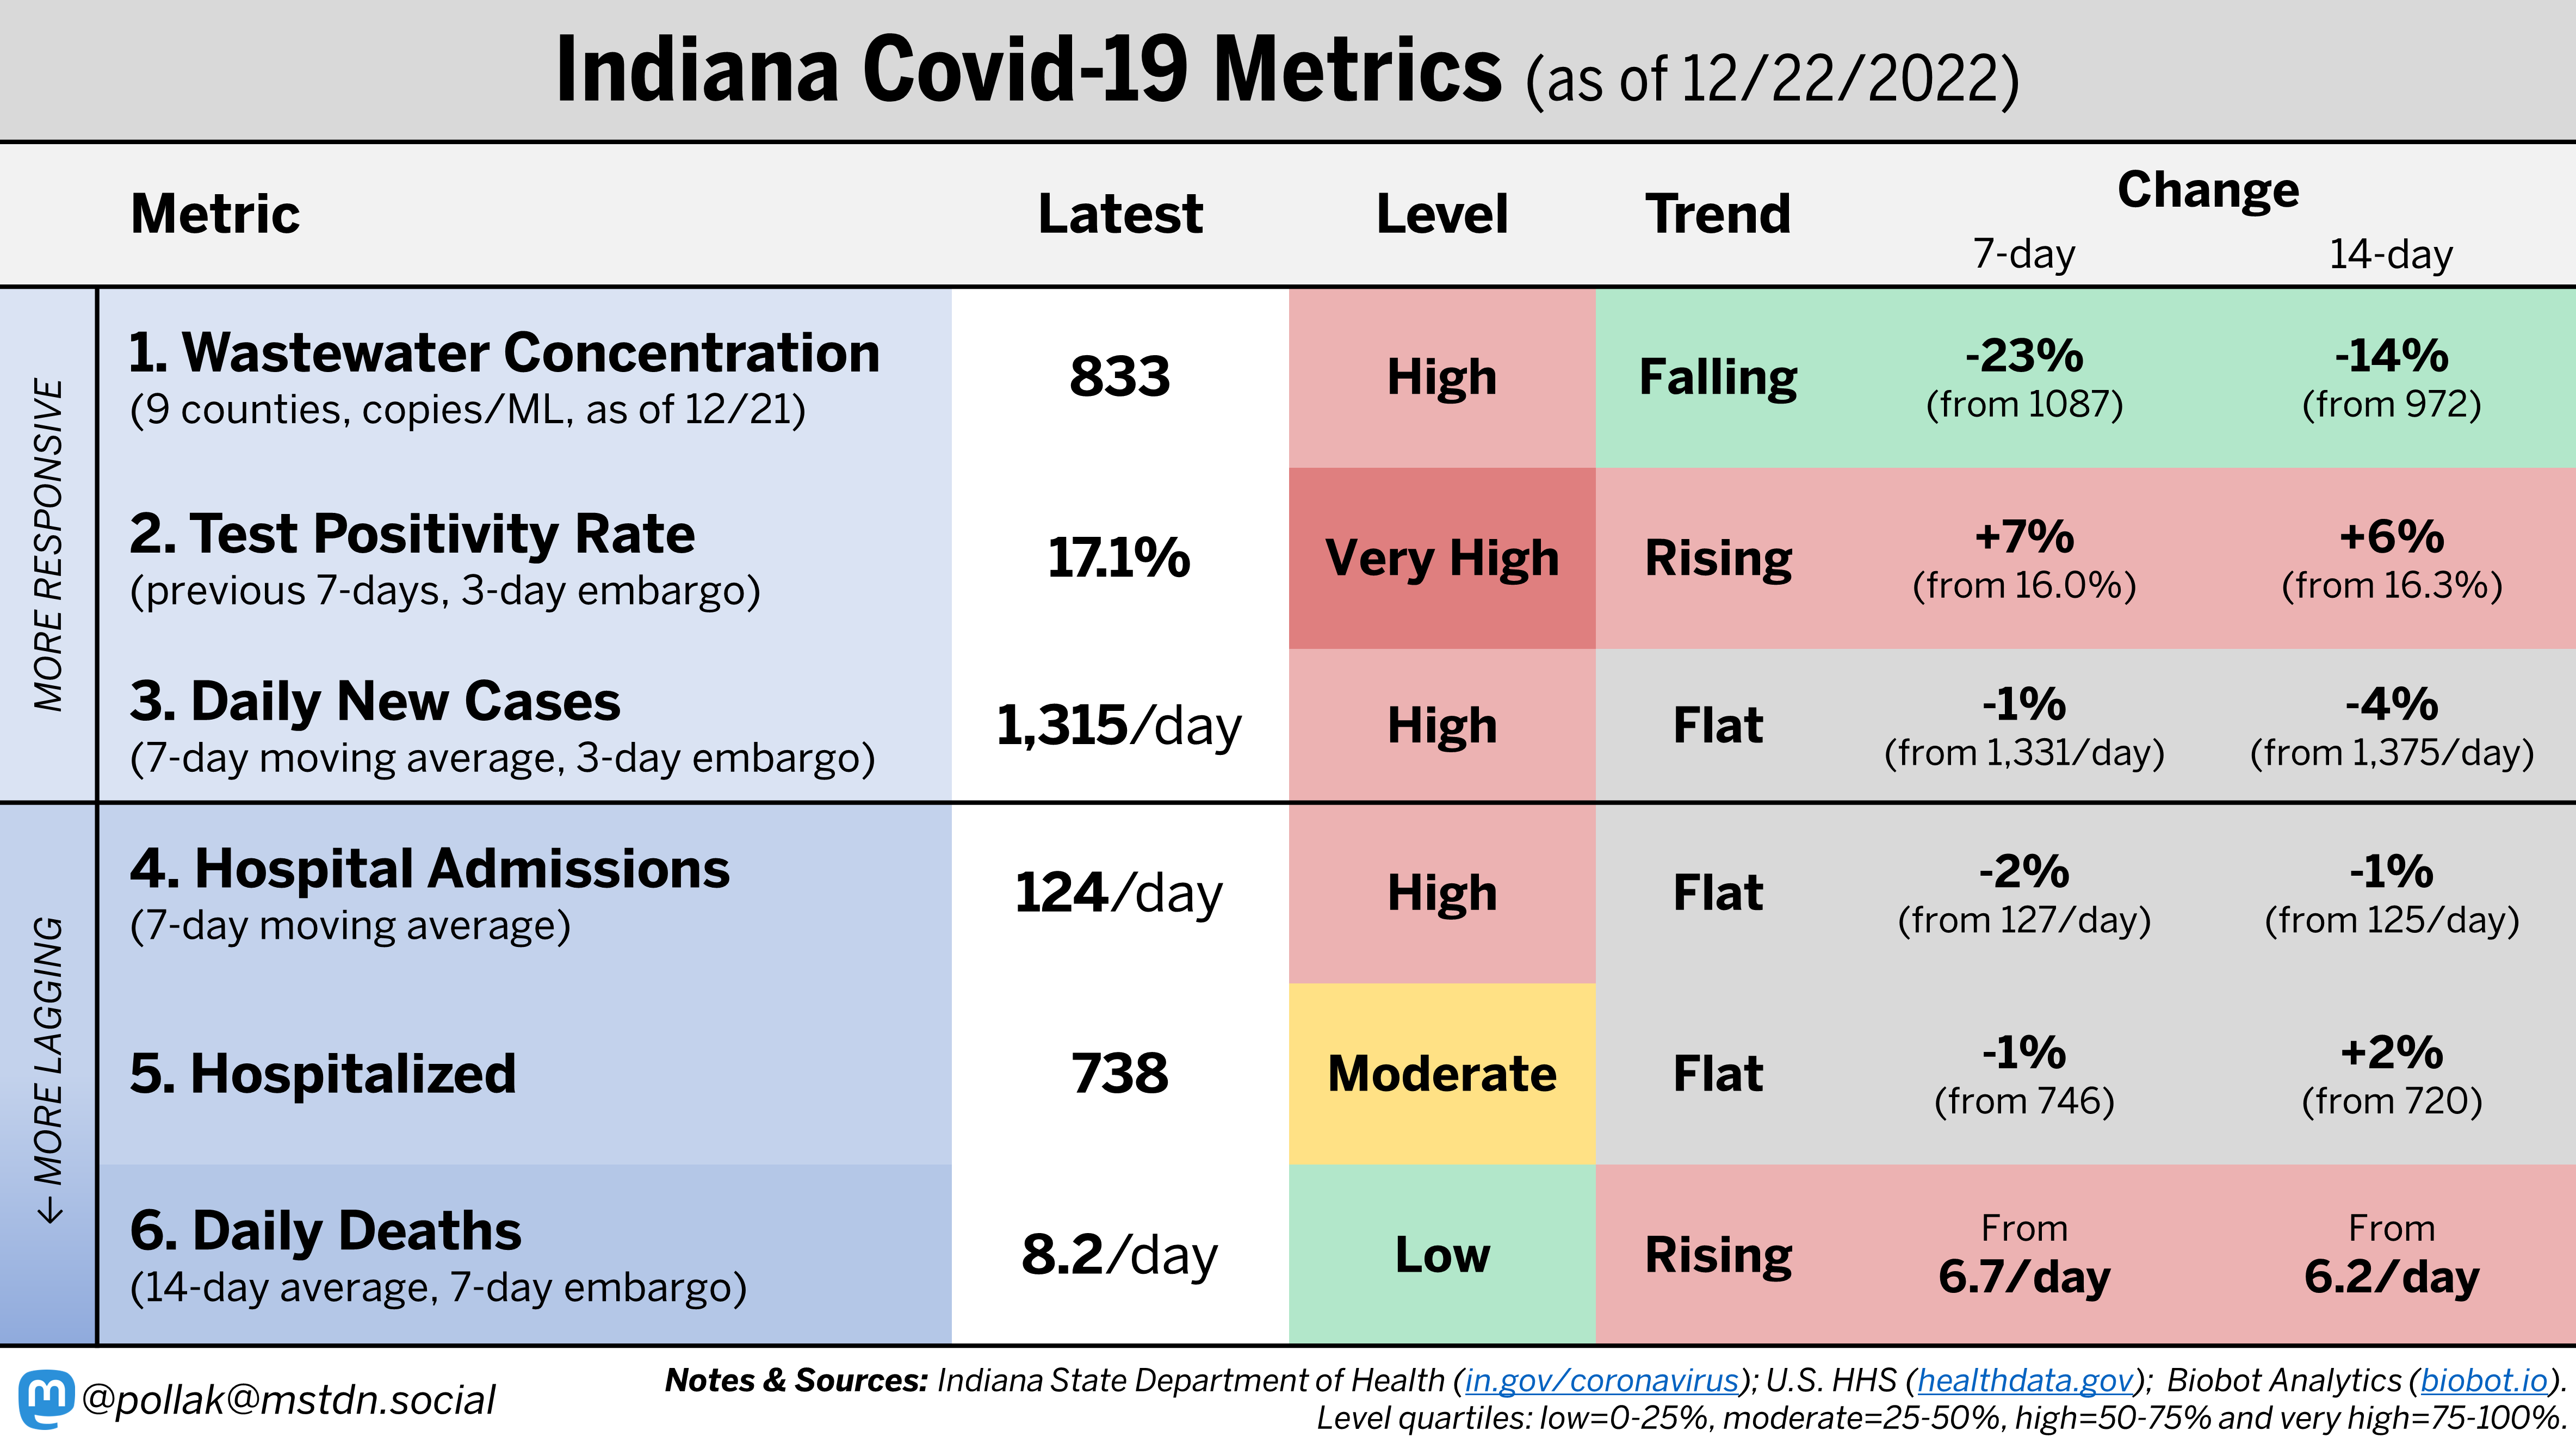
Below is the latest dashboard of Covid metrics for Indiana. At first glace, it looks promising. Wastewater viral concentration, arguably the best measure of infections we have, is falling. Cases, hospital admissions and the number of people hospitalized have plateaued. With kids home from school and people taking time off work we have entered the typical holiday Covid lull during the last few weeks of the year. However, as the charts further down will show, this lull is usually followed by a ‘holiday bounce’ as everything comes roaring back. For the last two years, the winter wave didn’t truely peak until late January, as much as 50% higher than where we were at the end of the year.
This will probably be my last Covid post for the year 2022 and so, in addition to giving you an update on the current situation to help arm you for family gatherings, I wanted to take this chance to look at some of the metrics in the dashboard above and see how they stack up versus this time of year during the previous two years.
Wastewater Concentration
Monitoring the concentration of the SARS-CoV-2 virus in sewage has rapidly become the best measure we have of the actual amount of virus out there circulating. It’s a measure that is not distorted by declining official testing or the widespread use of (unrecorded) at home testing. The chart below shows the wastewater viral concentration of the SARS-CoV-2 virus for the Midwest region of the United States by year (this data comes from BioBot Analytics’ awesome data). For the Midwest region, wastewater concentration levels are elevated (darkest green) as the year draws to close and similar to the levels we had during the first winter wave (Dec. 2020). Thankfully, they’re only about a third of the level we had last year during the massive Omicron wave of infections. This is really reassuring data, as it’s strong evidence against any kind of massive Covid wave flying under the radar.
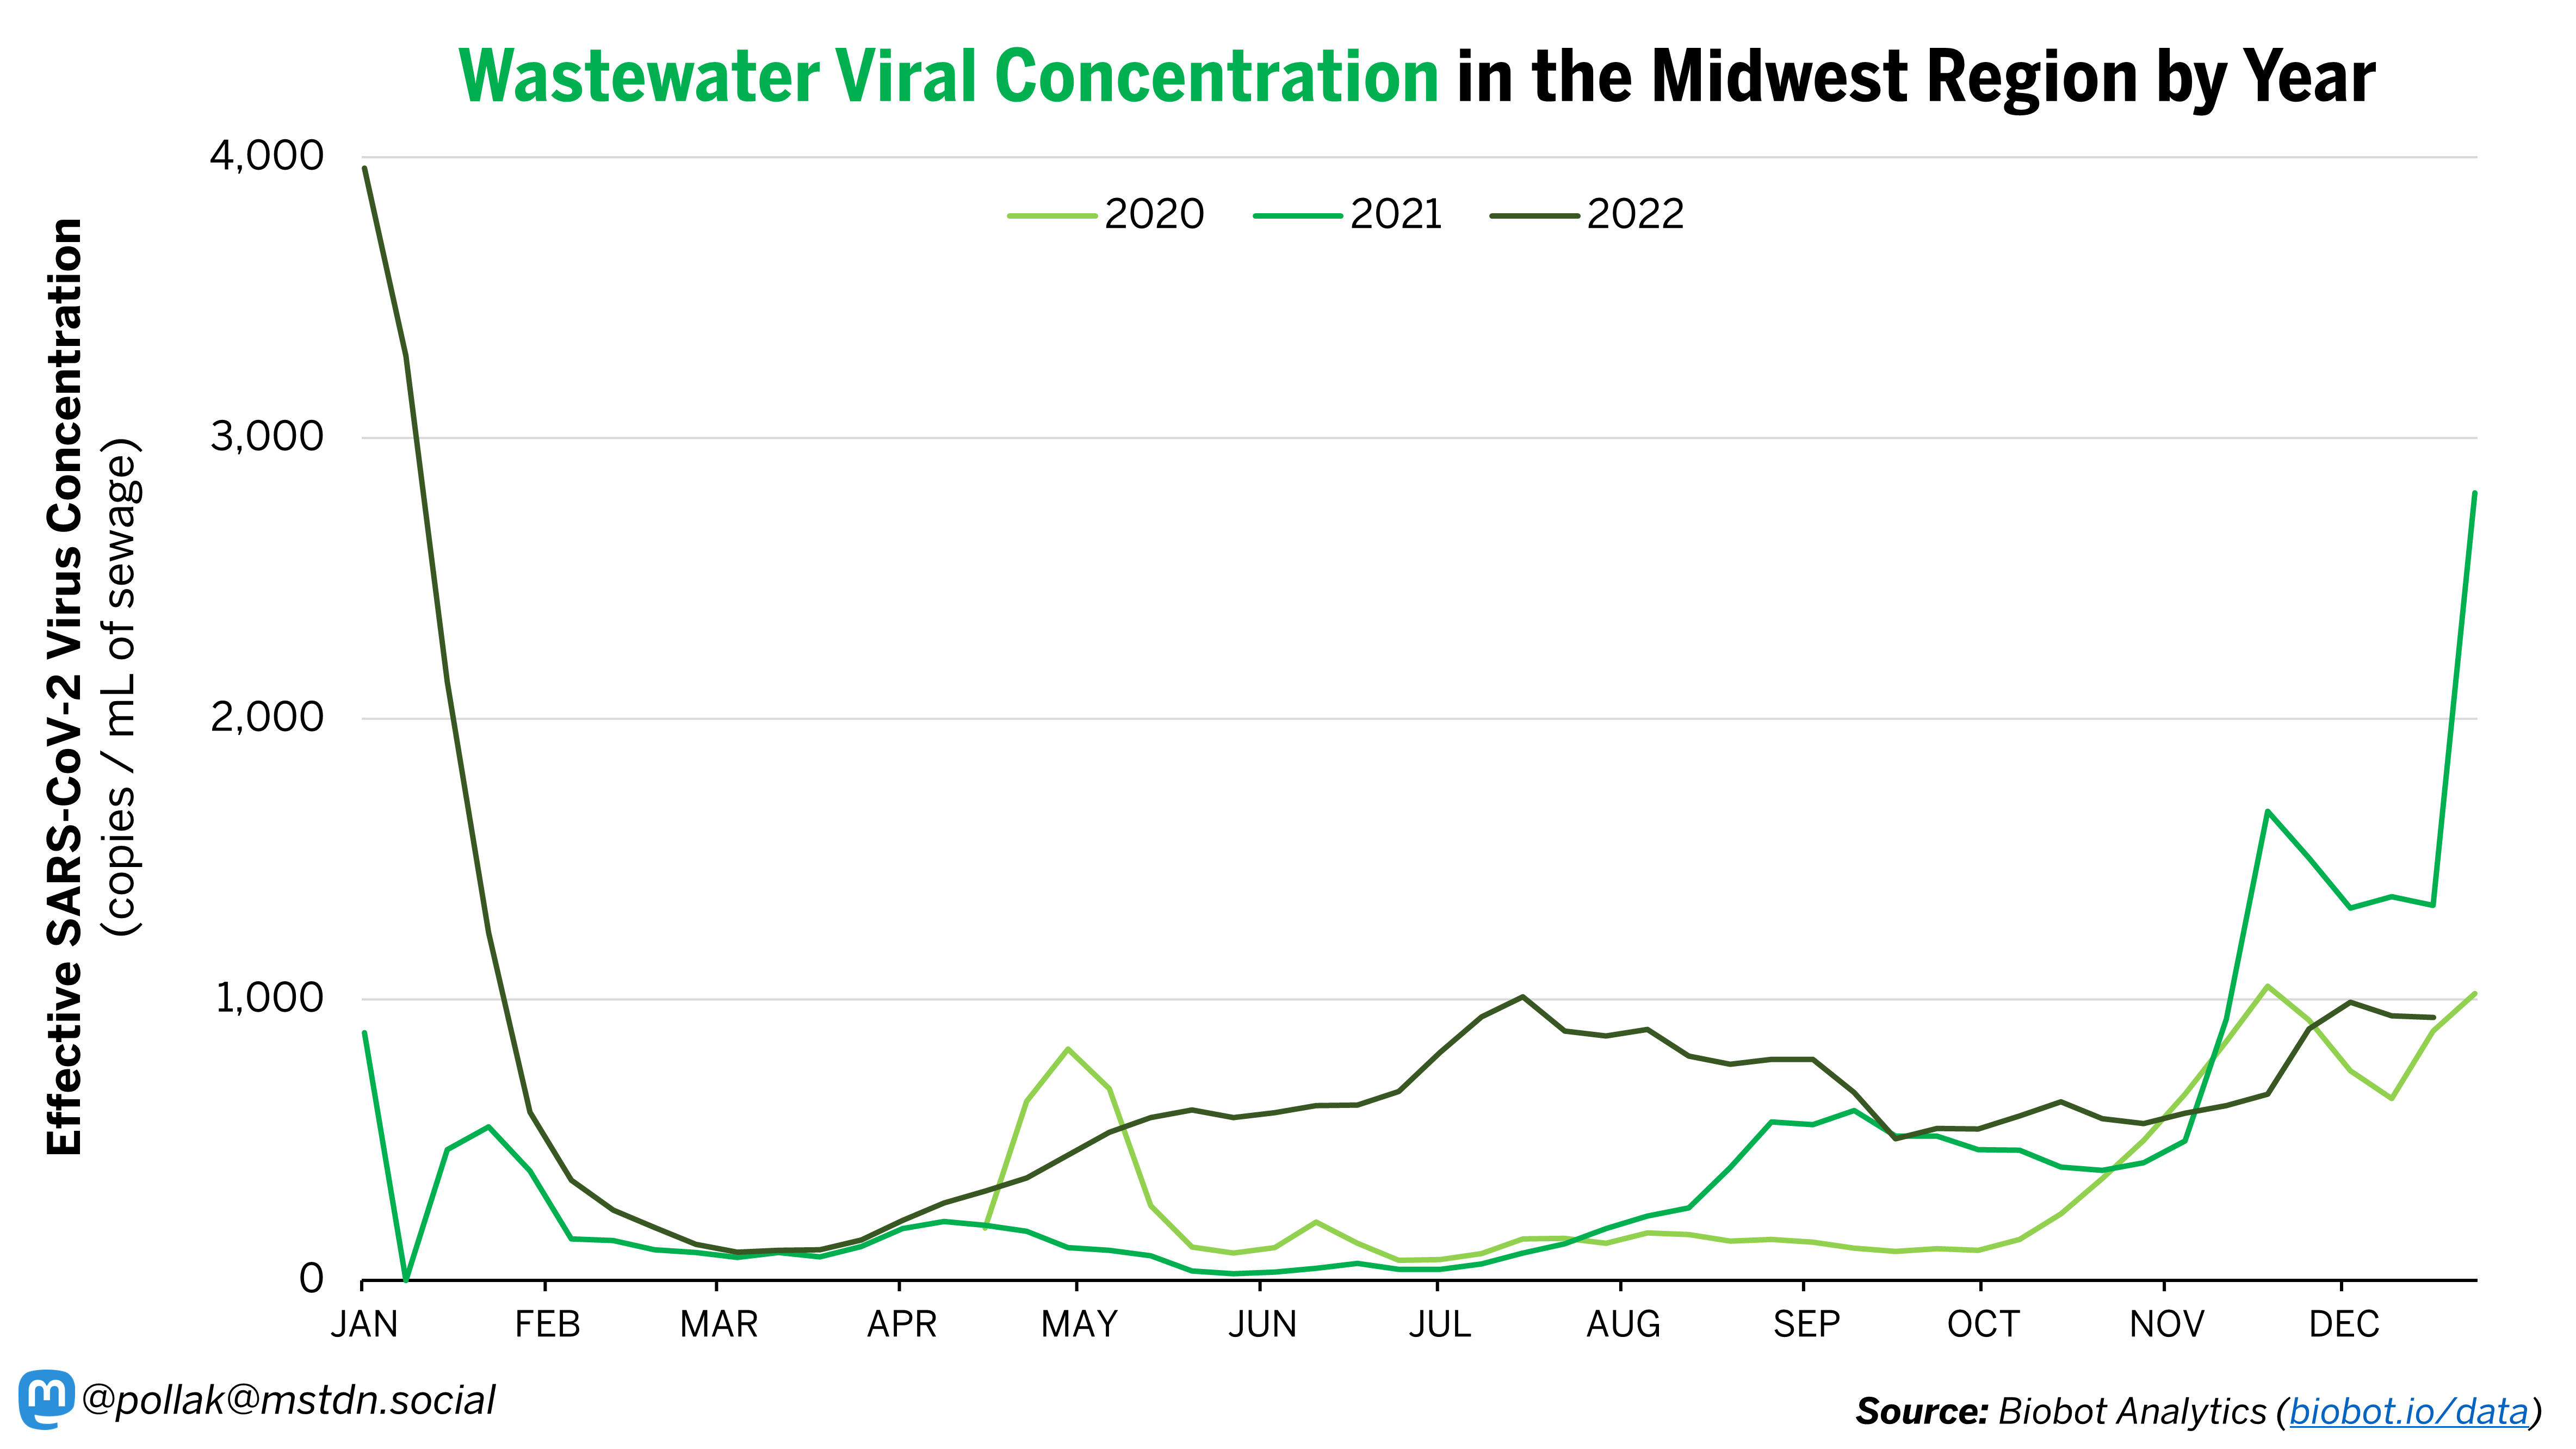
Keep in mind the chart above is for the entire Midwest region. If we look at the limited county-level data that goes back to 2020, there’s some evidence that Indiana may be faring even better than the Midwest.
Hospital Admissions and Hospitalized
I’m going to skip over any comparisons of test positivity rate and daily new cases since testing availability and attitudes towards testing are dramatically different this December compared with the previous two. Instead, let’s compare another metric that is a better reflection of both the amount of infections out there and their severity. The chart below compares the average daily hospital admissions for Covid today (darkest purple line) versus this same point during the last two years. Here there is a stark difference from previous years.
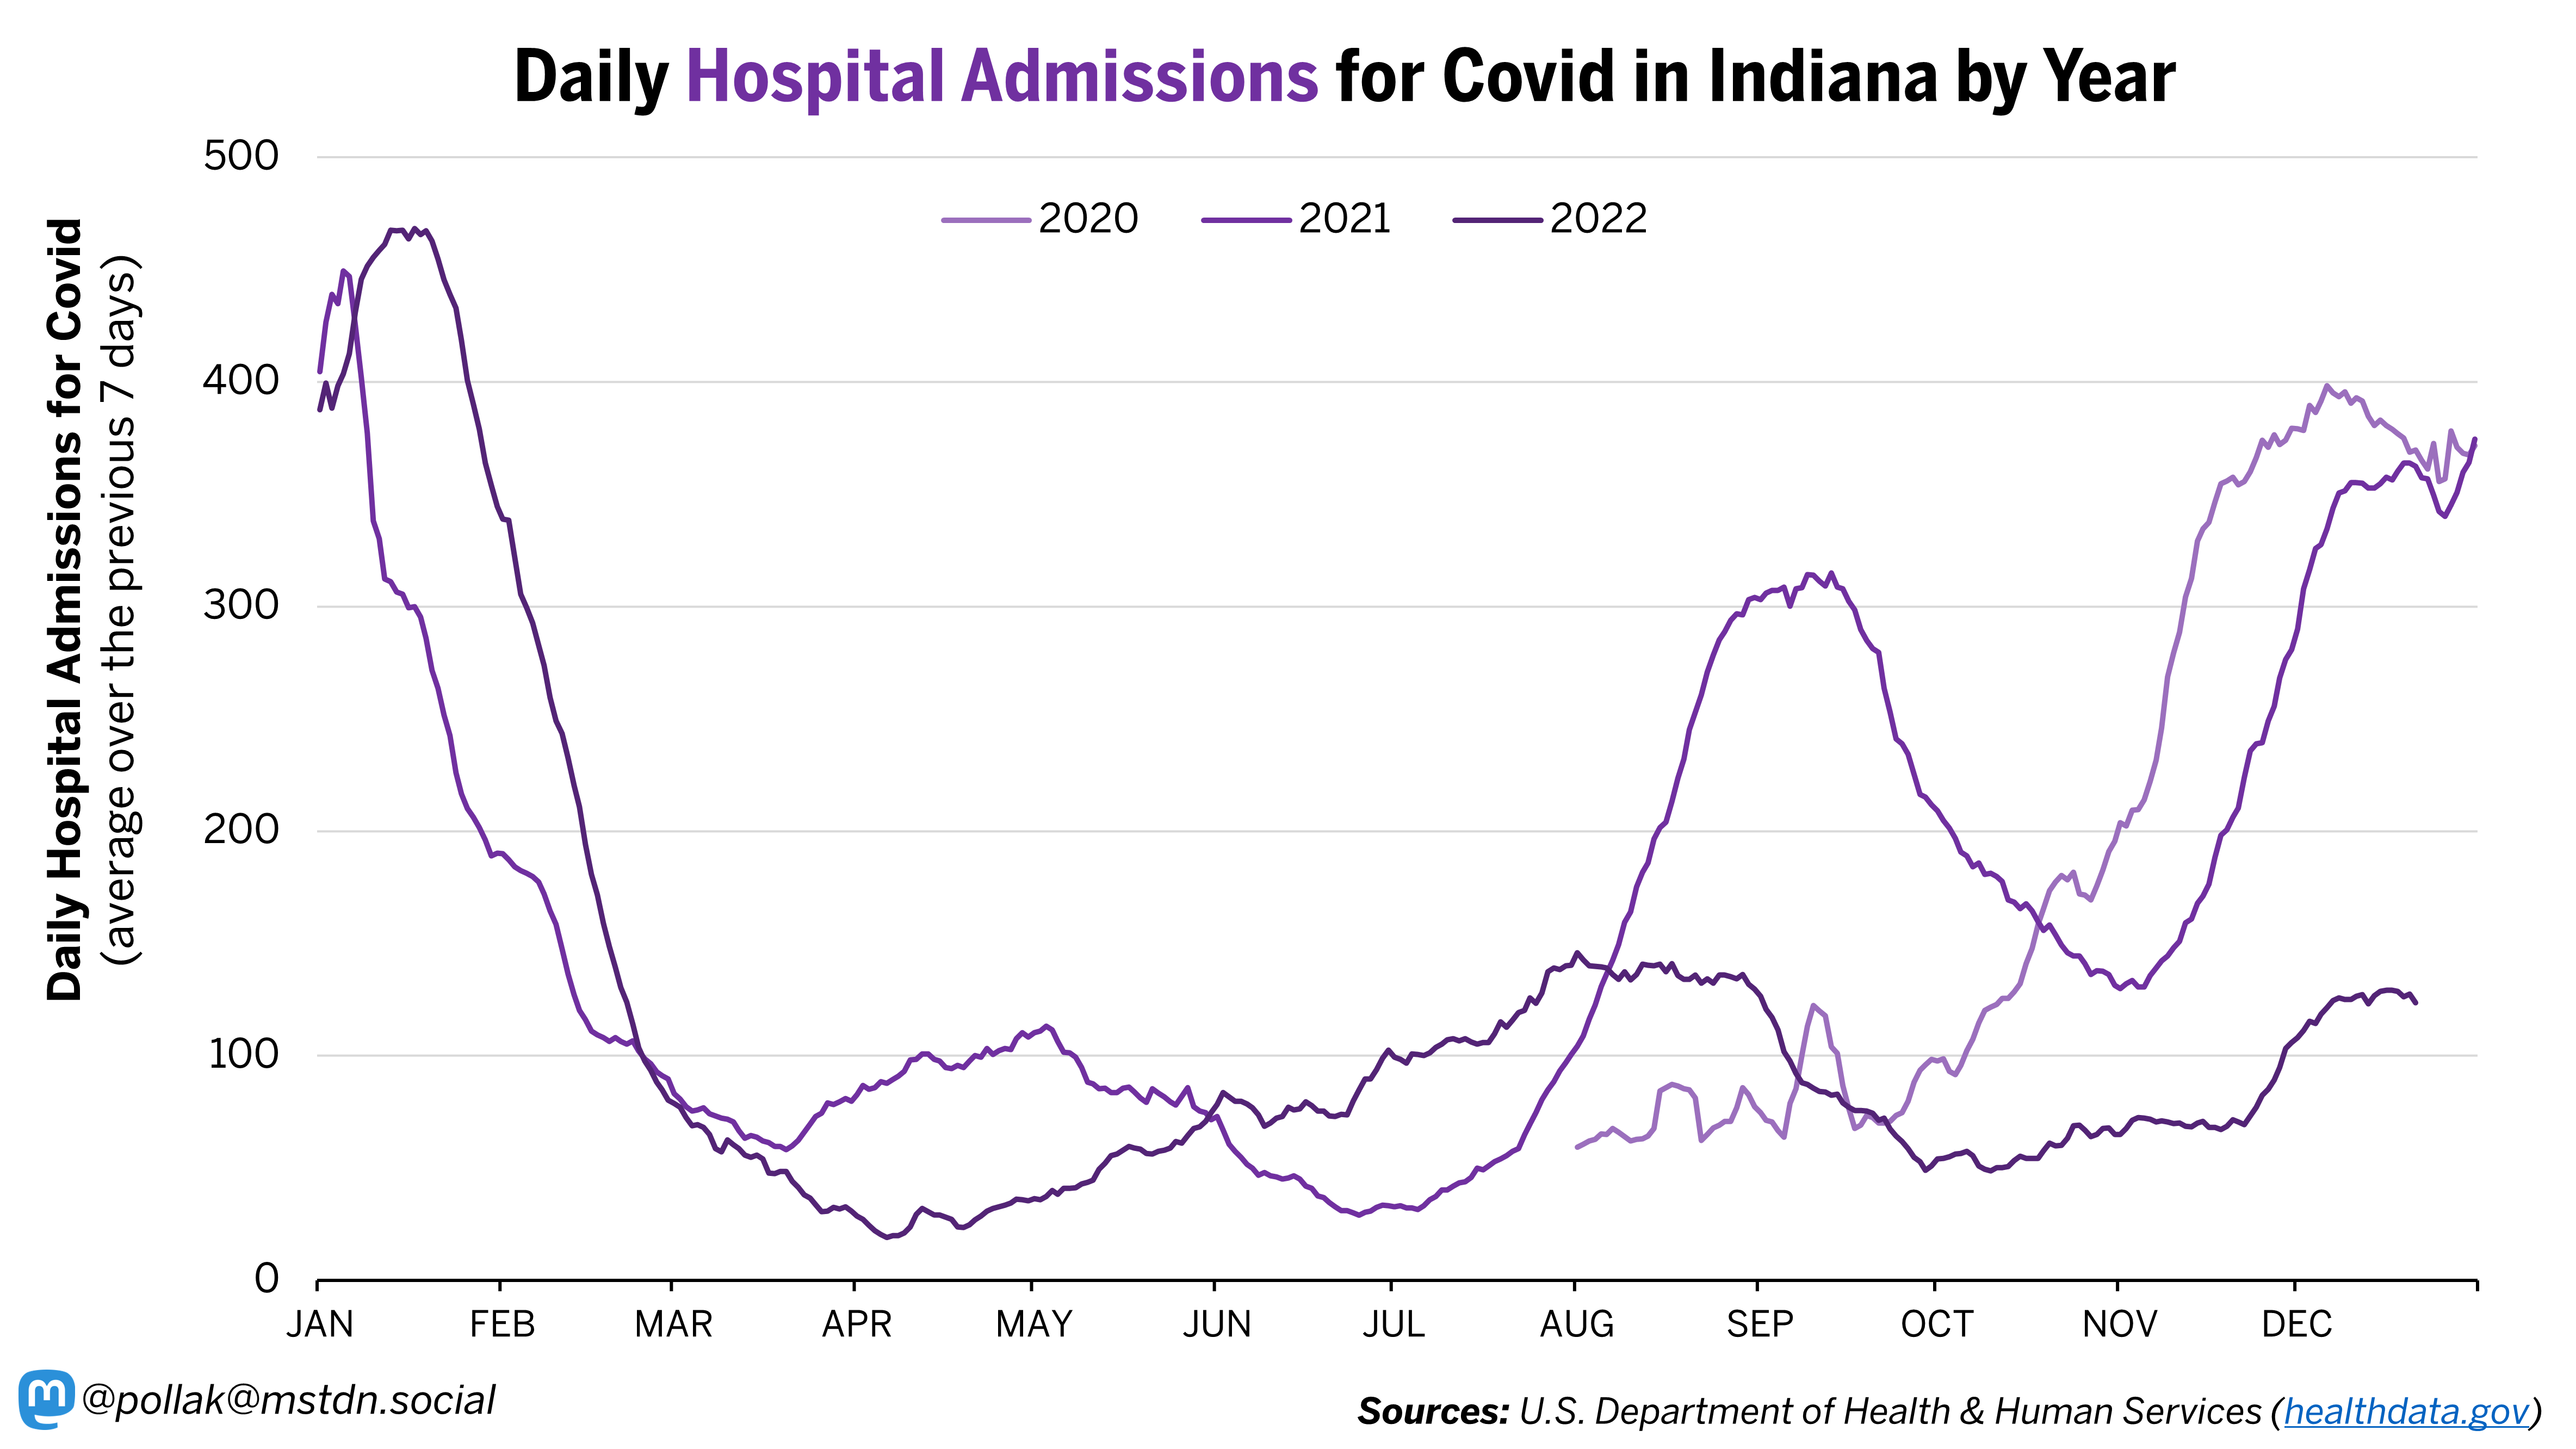
Both in 2021 and 2020 we were admitting anywhere from 350-400 people per day for Covid into Indiana hospitals during December, many of these into ICUs. This year we’ve only seen a fraction of this, with about 125 admissions per day. While this is still high, the majority of these admissions are not severe enough to need ICU care and most return home quickly. Every ICU doctor and nurse I’ve spoken with has said they’re currently caring for few to no Covid patients. This is fantastic and means the protection we’ve been building through vaccinations (and, less ideally, prior infections) is working to protect many of us from serious illness. While I won’t include it here, the graph of the number of people currently hospitalized for Covid is very similar.
That being said, many healthcare workers are still being overwhelmed because we’re experiencing one of the worst flu seasons in a quarter of a century (which I wrote about last week), as well as probably one of the worst RSV seasons, all on top of being short-staffed due to burnout. So, please do something nice for your neighbor, friend or family member who works in healthcare, such as wearing a mask to reduce the chance that you’ll need their care.
Daily Deaths
While hospital admissions this December are far less compared to the previous two Decembers, the most impressive victory is the reduction in deaths from Covid. The chart below shows average daily deaths per day from Covid in Indiana for the last three years.
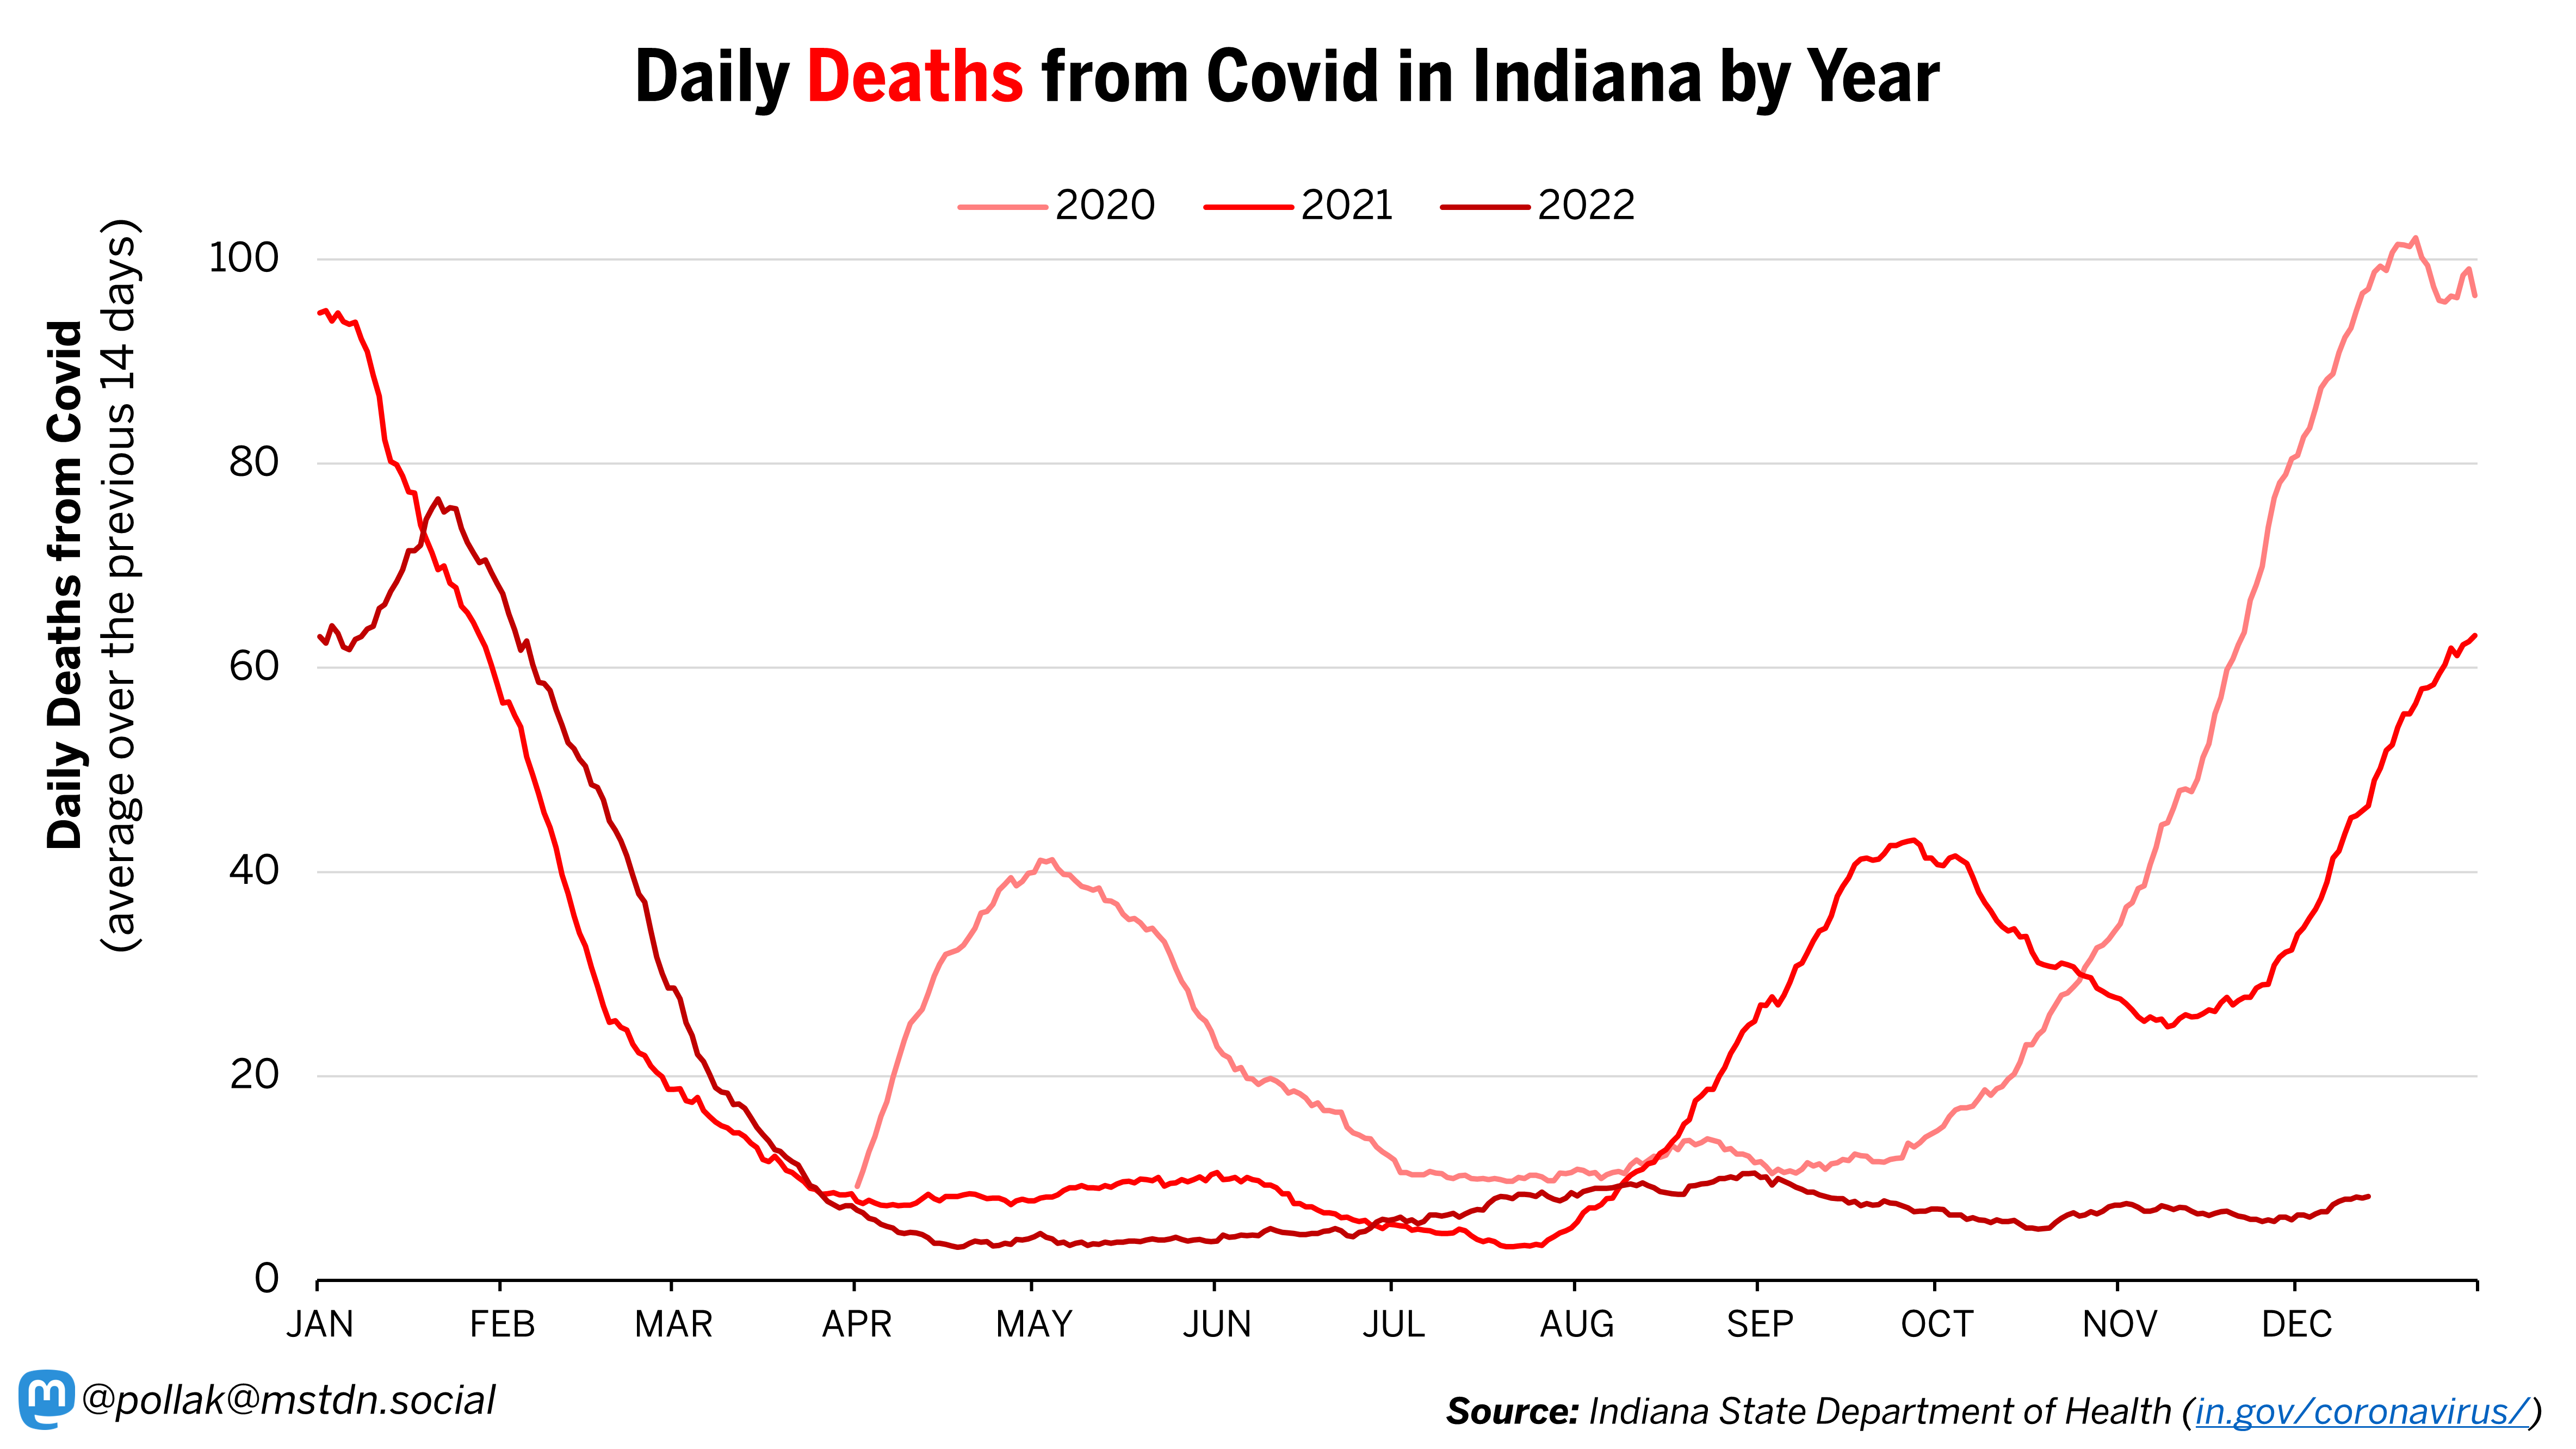
Here are the number of average daily deaths from Covid in Indiana on the same day, over three years:
On 12/13/2020 we were averaging 97.1 deaths per day from Covid.
On 12/13/2021 we were averaging 46.5 deaths per day from Covid.
On 12/13/2022 we were averaging 8.2 deaths per day from Covid.
Today we have an 82% reduction in daily deaths from Covid compared to one year ago and a 92% reduction in deaths from Covid compared to two years ago. While death is far from the only severe outcome, this is a statistic we should celebrate.
Key takeaways
My three key takeaways are:
So far, this year has been the mildest winter Covid wave since the pandemic began. We’re not out of the woods yet, and we should expect a holiday bounce in the next 30-45 days, but we’re in a much, much better place than the previous two years.
Protection from vaccines (and, less ideally, prior infections) is working very well to protect many of us from serious illness. We should be thankful for that and continue to keep our vaccination current.
This fall and winter has really been the season of Influenza and RSV, more than Covid. It’s not too late to get your flu shot (there’s no RSV vaccine) and please considering wearing a high quality mask (N95, KN94 or KF94) in public spaces and avoiding or limiting the number of large gatherings for the sake of our overloaded healthcare workers.
Have a Merry Christmas and a Happy Hanukah, Happy Kwanzaa, and anything else you celebrate! See you in the New Year!
I am eligible for my sixth shot in three weeks, should I get it? I have had Covid twice (once was my fault, the other time is was an unmasked kids fault) and I wear a high quality mask everywhere I go, even though I’m nearly the only one, but the safety it’s provided me is obvious, plus healthcare workers stop and thank me ALL THE TIME.
I appreciate these updates more than you know. Thank you so very much